
Watches and warnings
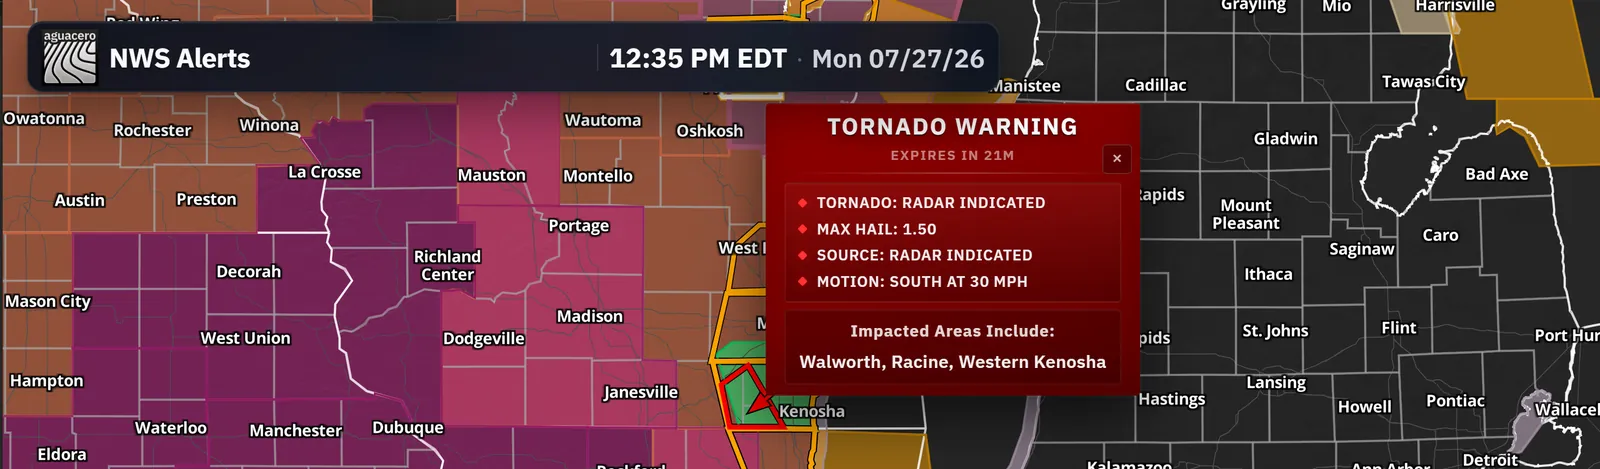
Every NWS alert, live over NWWS, with your own fill, outline, flash and sound for each alert type, and popups that show the population covered.
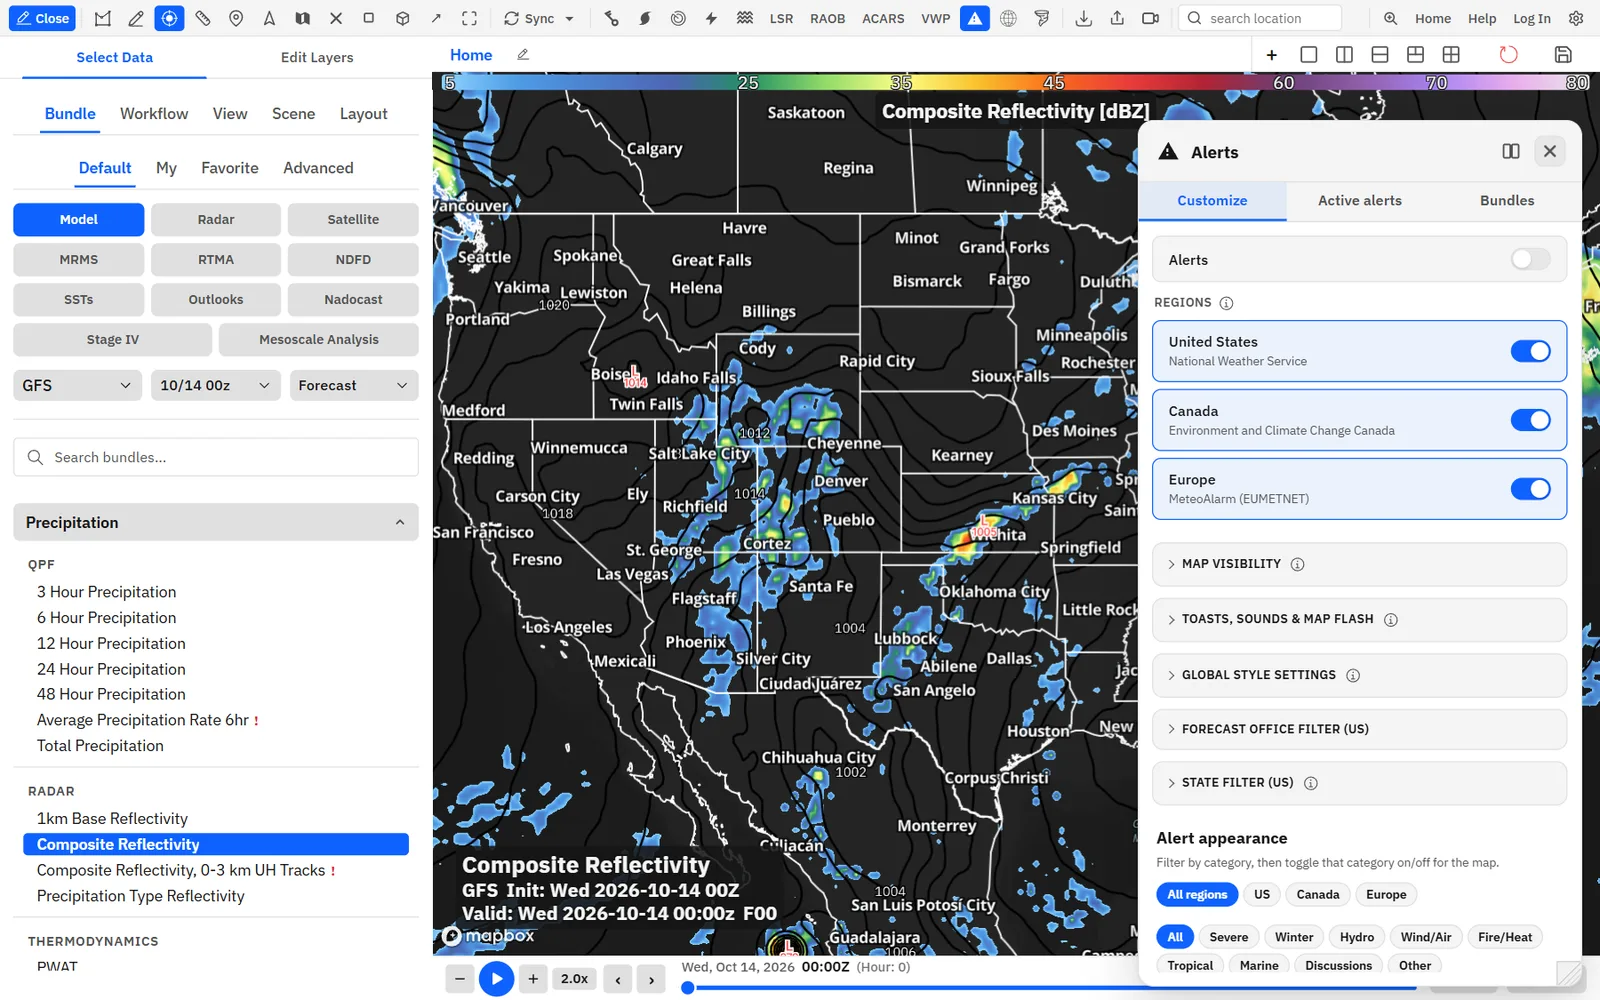
Show me in the app- Double-click Alerts on the toolbar to show alerts on the map.
- Single-click Alerts to open the alert settings on the Customize tab.
- Under Alert appearance, pick a category such as Severe or Winter, then turn alert types on or off.
- Click an alert type to set its Polygon fill, Outline, Sound & notification and Map flash.
- Click an alert on the map. The popup shows its start and end times, threats, area and Population.
- Click Details in the popup for the full bulletin text.
Tips
- The Active alerts tab lists every alert in effect. Click one to fly to it and turn on the nearest radar.
- Toasts, sounds & map flash turns popup notifications, beeps and the map flash for new alerts on or off.
- Save your colors, sounds and filters as a preset on the Bundles tab.
Filter alerts by office or state
Show only the US alerts from the forecast offices or states you pick.
- Single-click Alerts on the toolbar.
- On the Customize tab, open Forecast office filter (US).
- Type an office code in Add code (e.g. MKX) and click Add, or pick codes from the list.
- To filter by state, open State filter (US) and pick one or more states.
- Click Clear offices or Clear states to show every alert again.
While an office or state filter is set, Canadian and European alerts are hidden. When both filters are set, they combine.
Canadian and European alerts
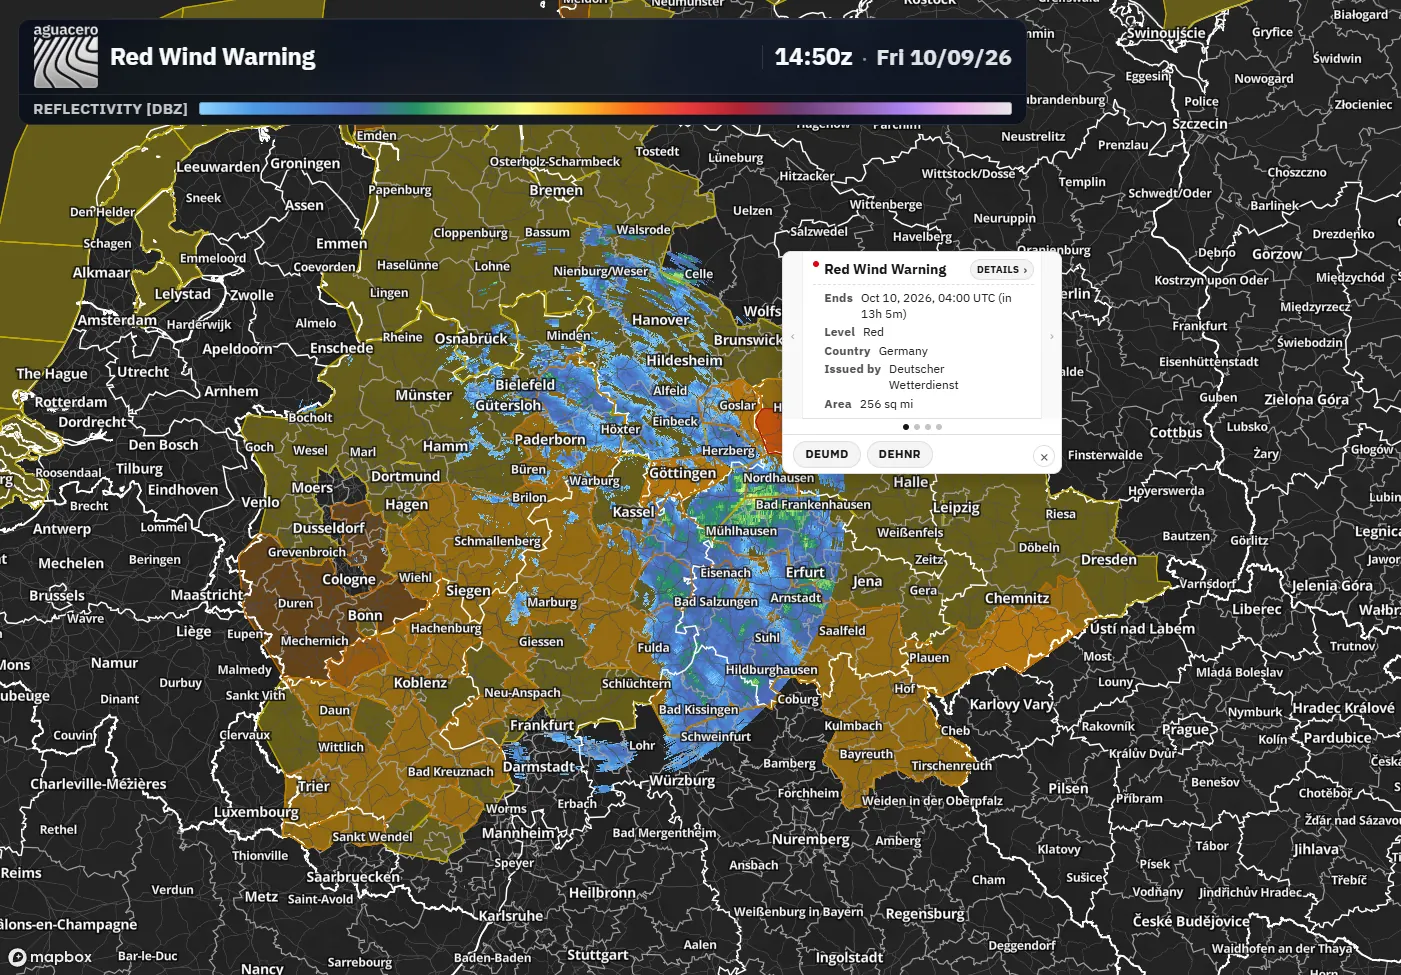
Environment and Climate Change Canada and MeteoAlarm warnings in the same alerts layer, with the same styling and time slider.
Show me in the app- Single-click Alerts on the toolbar.
- On the Customize tab, find Regions.
- Turn Canada or Europe on or off. United States has its own toggle.
- Under Alert appearance, click Canada or Europe to list and style that region’s alert types.
Turning a region off hides it on the map, in Active alerts and in the ticker, and stops its notifications and sounds.
Custom alert soundsCreator
Upload your own MP3s and play them when a new alert of a given type arrives.
Show me in the app- Single-click Alerts on the toolbar.
- Under Alert appearance, click the alert type, for example a tornado warning.
- Under Sound & notification, click Upload and choose an MP3.
- Pick your file under Your MP3s in the Sound menu.
- Click Preview to hear it.
Tips
- Every plan can pick built-in tones, such as Beep, Chime or Siren, in the same Sound menu.
Needs Creator and a signed-in account. Each MP3 can be up to 2 MB and 30 seconds.
SPC outlooks, watches and discussions
Convective outlooks out to day 8 and fire weather outlooks, plus SPC watches and mesoscale discussions in the alerts layer.
Show me in the app- Click NOAA data on the toolbar to open Forecast Products.
- On the SPC tab, pick Thunderstorm or Fire Weather.
- Pick a type, such as Categorical, Tornado or Dry Thunderstorm, then turn on a day.
- For watches and mesoscale discussions, turn on alerts, then make sure the Severe and Discussions categories are on in the alert settings.
Tips
- To have outlooks step through their valid periods as the time slider moves, turn on Move outlooks with time in Settings, Data, NOAA, under the SPC agency.
- Click an outlook on the map for its details.
Load outlooks from the sidebar
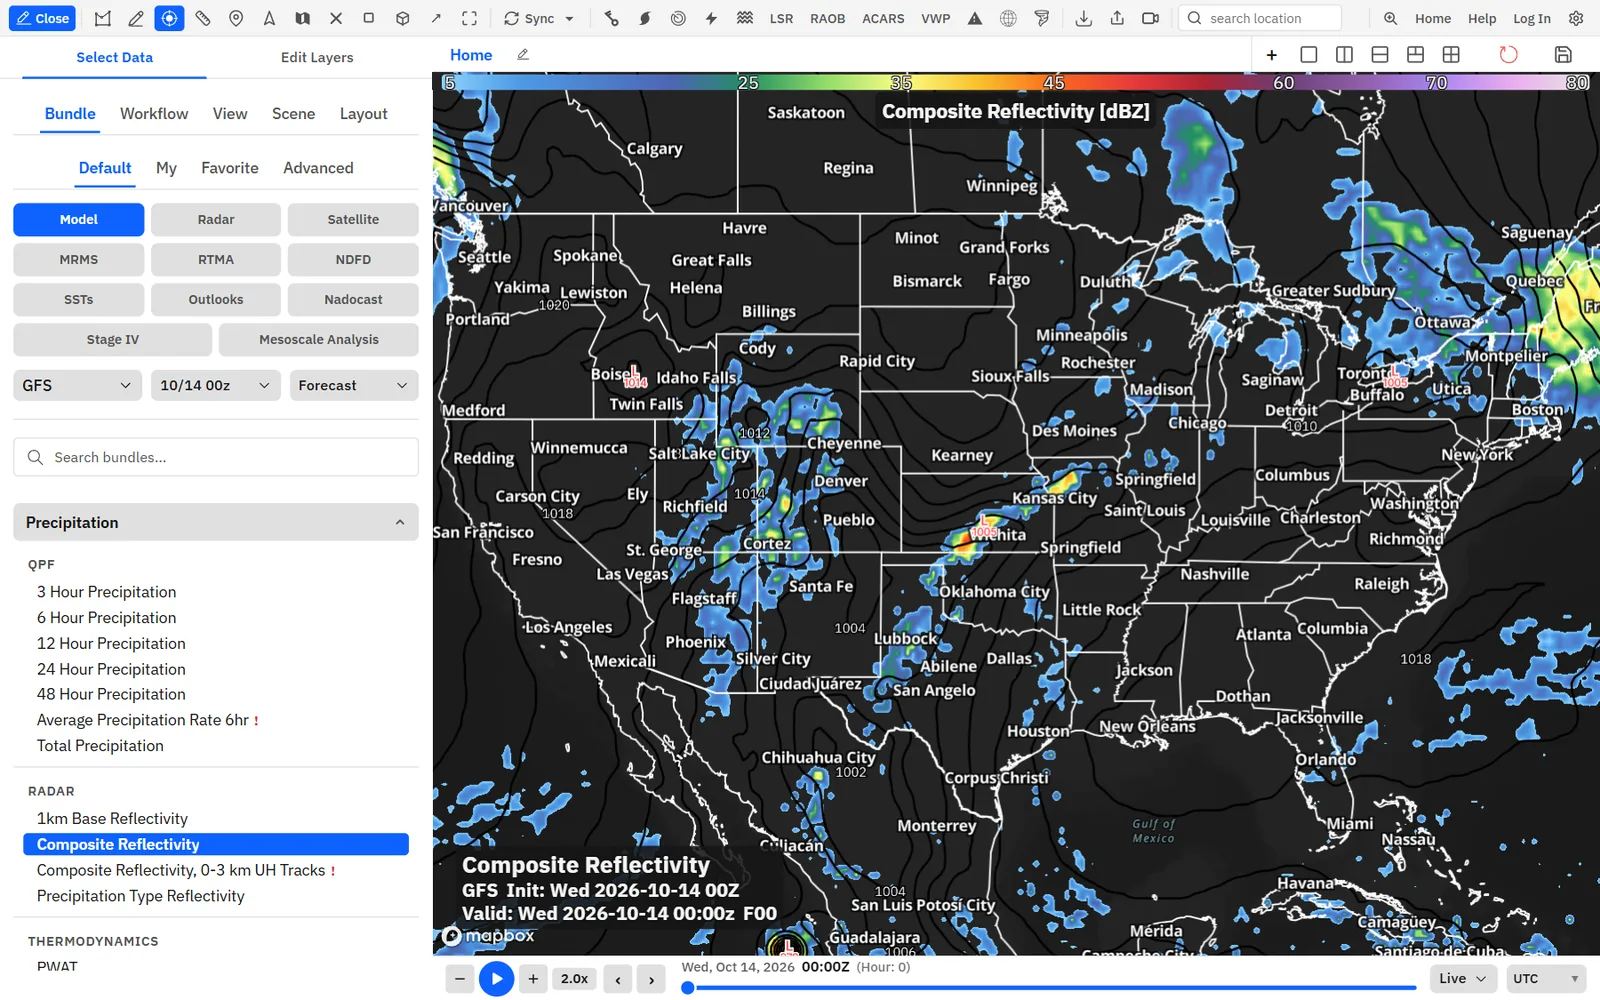
The Outlooks data type puts the same SPC, WPC, CPC, RFC, ECCC and ESTOFEX picker in the sidebar.
- Open the sidebar on Select Data.
- Click Outlooks in the data type filter.
- Pick an agency tab, then a product.
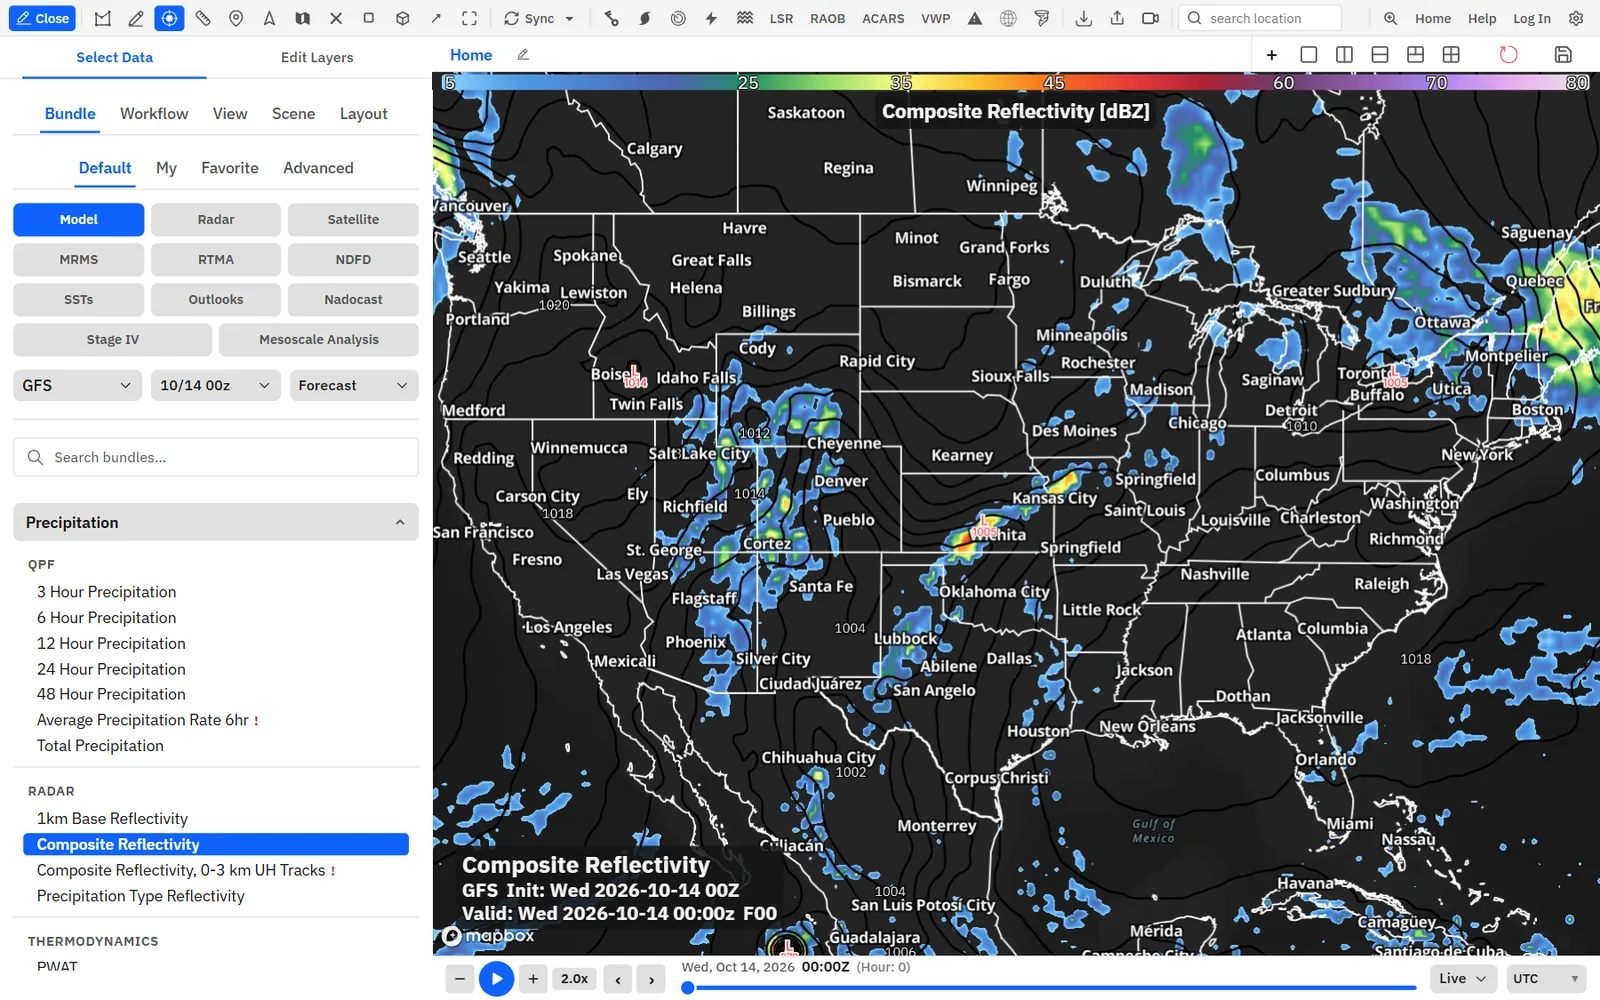
A product picked in the sidebar replaces the layers on the panel. To stack outlooks on top of other layers, use the NOAA data menu.
WPC products
Surface fronts, QPF with point readouts, excessive rain, winter products such as the WSSI, and the NWS HeatRisk map.
Show me in the app- Click NOAA data on the toolbar.
- Click the WPC tab.
- Pick a group: Surface Analysis for fronts, QPF, Excessive Rain, HeatRisk, or a winter group such as Winter Storm Severity Index (WSSI).
- Turn on the day or period you want.
Tips
- For QPF values on the map, open Edit Layers and turn on the Point badge on the QPF layer.
CPC outlooks
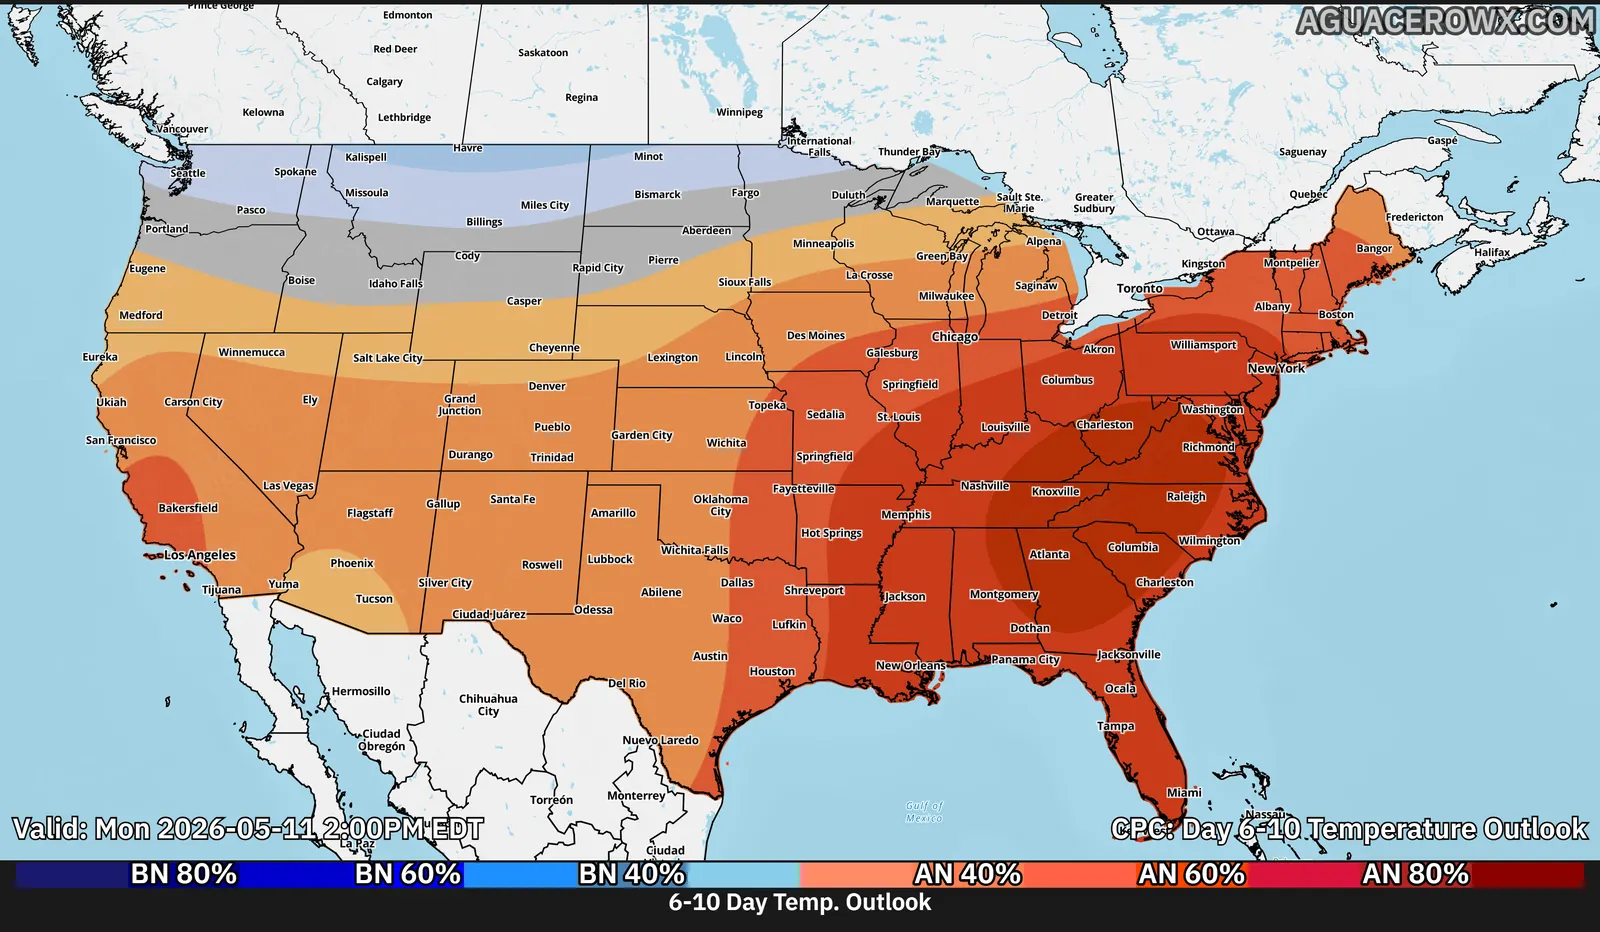
6–10 day, 8–14 day, week 3–4, 1-month and 3-month temperature and precipitation outlooks, plus drought and hazards outlooks.
Show me in the app- Click NOAA data on the toolbar.
- Click the CPC tab.
- Under Precip/Temp Outlook, pick Temperature or Precipitation.
- Turn on a period: Days 6-10, Days 8-14, Weeks 3-4, 1 Month or 3 Month.
SPC Mesoscale Analysis
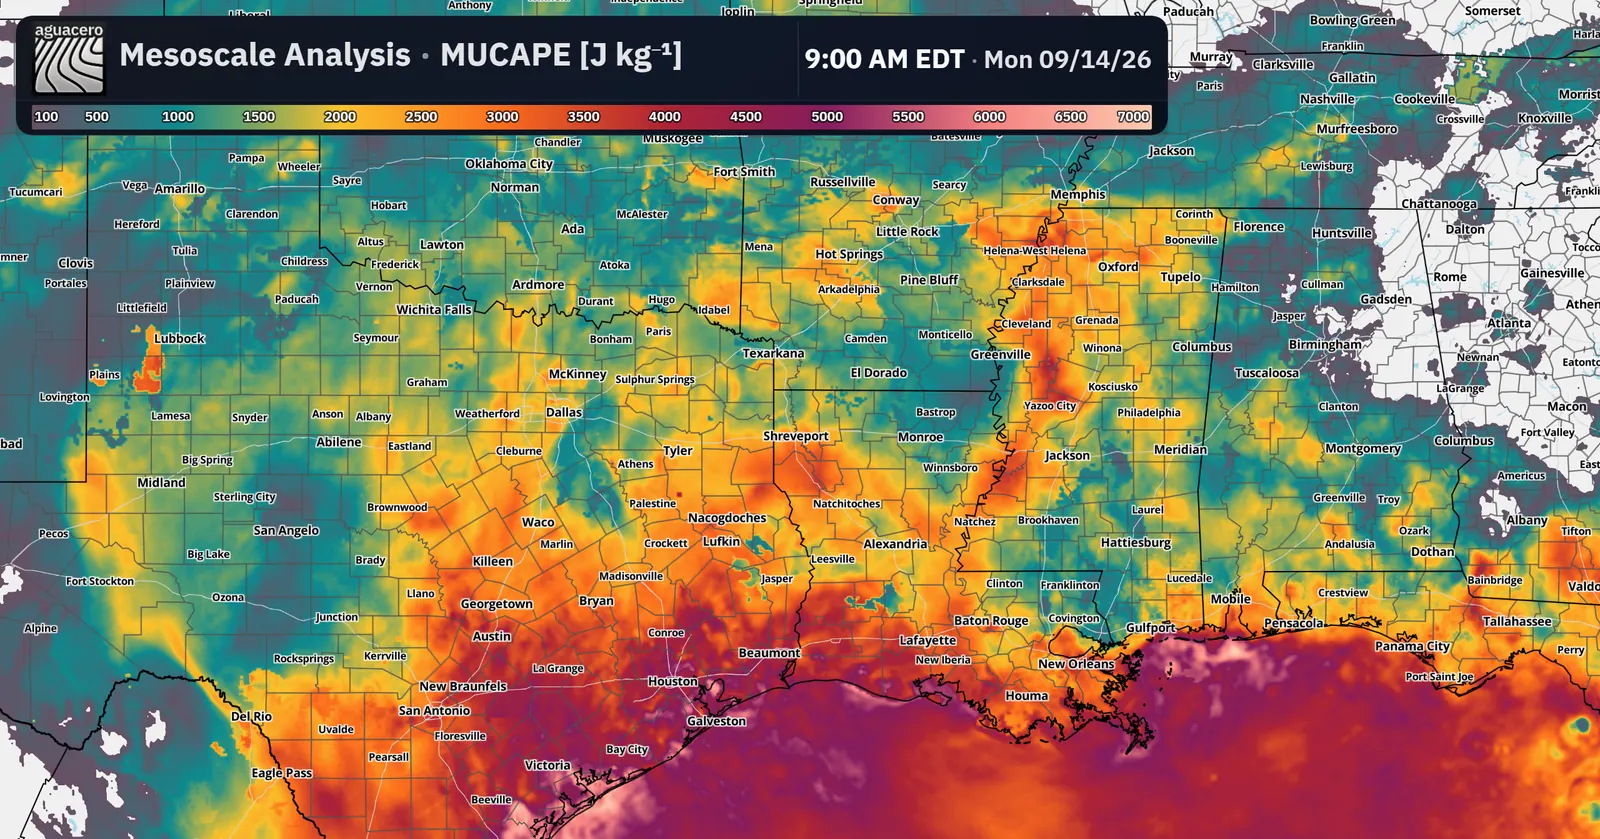
Hourly convective diagnostics on the 3 km HRRR grid, with point and box soundings.
Show me in the app- Open the sidebar on Select Data.
- Click Mesoscale Analysis in the data type filter.
- Click a bundle in the list to load it.
- Set how many hours to load with the Mesoscale duration menu on the time bar.
- Right-click the map and click Meso analysis under Soundings for a sounding from the analysis.
Tips
- To add one field instead, use Add Layer, then Mesoscale Analysis.
History: 12 hours on Free, 24 hours on Enthusiast and 72 hours on Professional.
NADOCAST
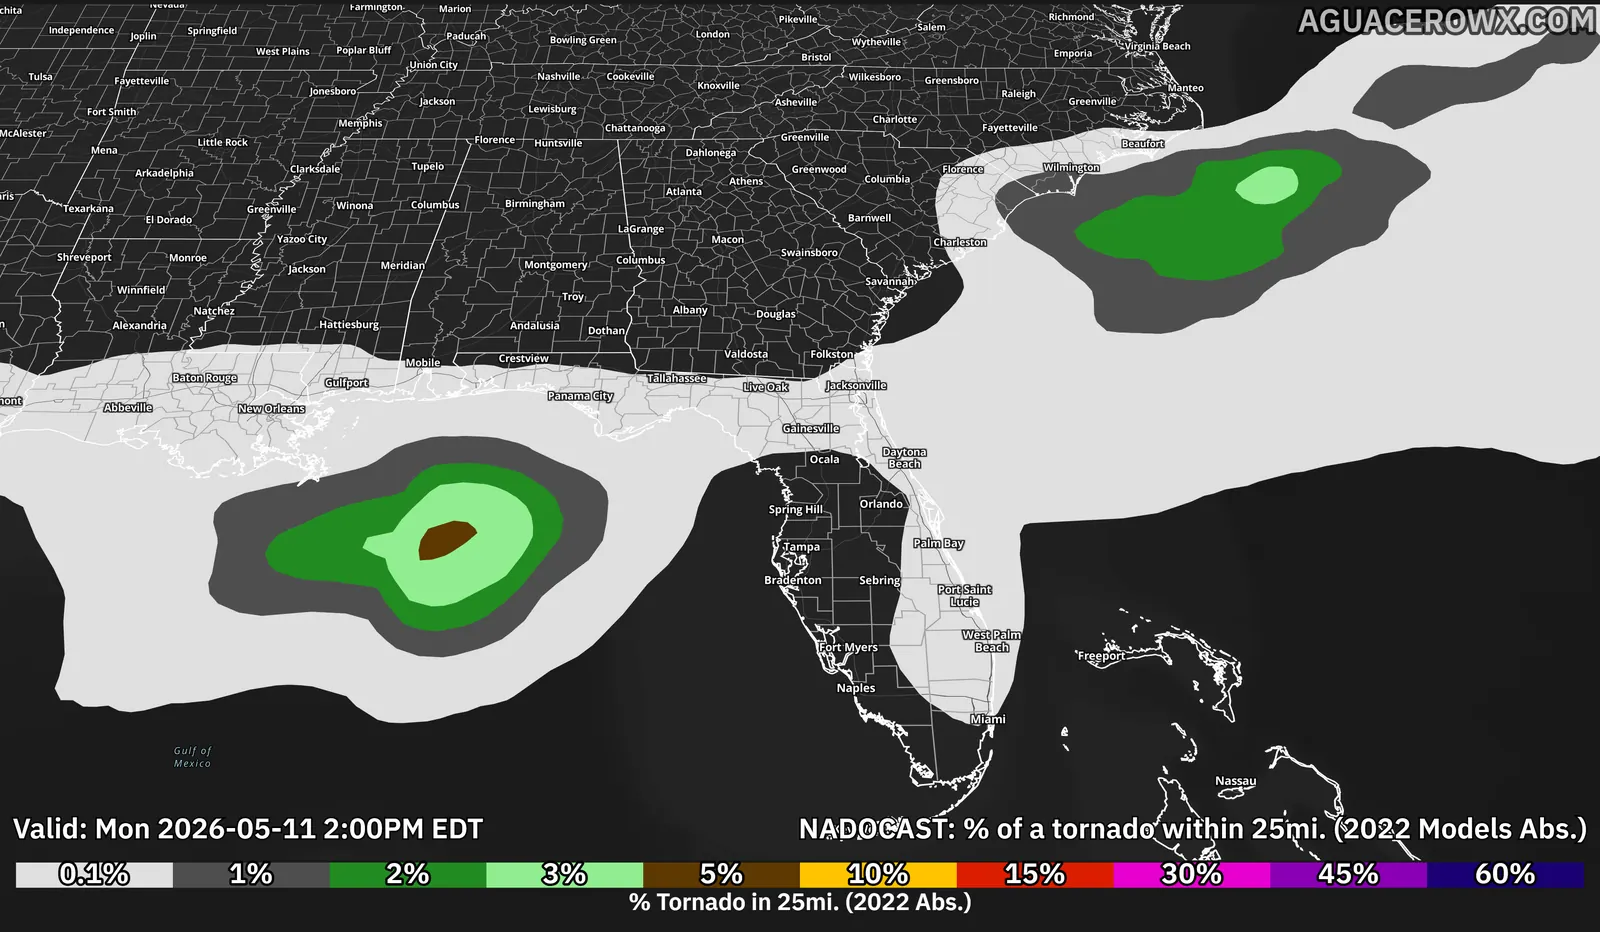
Machine-learning tornado, hail and wind probabilities, with run switching and a Day 2 forecast when the run has one.
Show me in the app- Click NADOCAST on the toolbar.
- Pick a run in the Run menu.
- Click Day 1 Forecast or Day 2 Forecast when both are shown.
- Pick 2022 Models or 2024 Models.
- Turn on a tornado, hail or wind product.
Tips
- The Nadocast data type in the sidebar has the same picker.
Damage Assessment Toolkit
NWS damage survey points, tracks and polygons, with EF ratings, for past events in archive mode.
Show me in the app- Switch the time bar from Live to Archive.
- In Archive Builder, set the window for the event.
- Under Overlays, turn on DAT damage.
- Click Apply.
- Click a damage point or track for its EF rating, wind speed, survey office and date.
Tips
- Change which layers show and the EF-scale colors in the DAT damage settings.
DAT damage surveys are available only in archive mode.