
ASOS and METARs
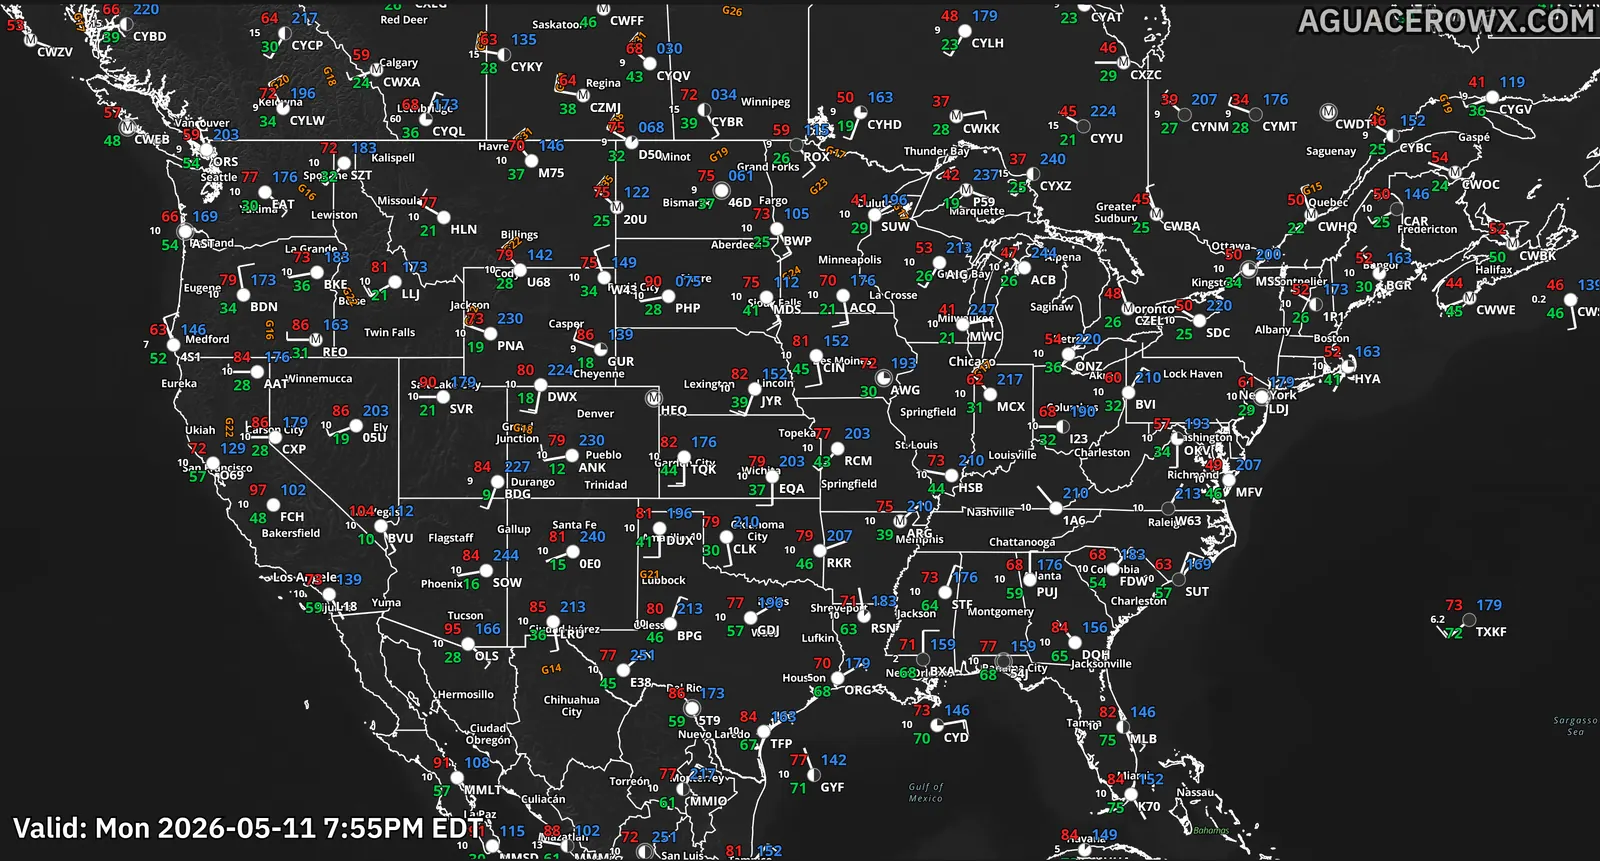
Surface station plots with raw METARs, wet bulb and relative humidity, RAWS stations and your own colormaps.
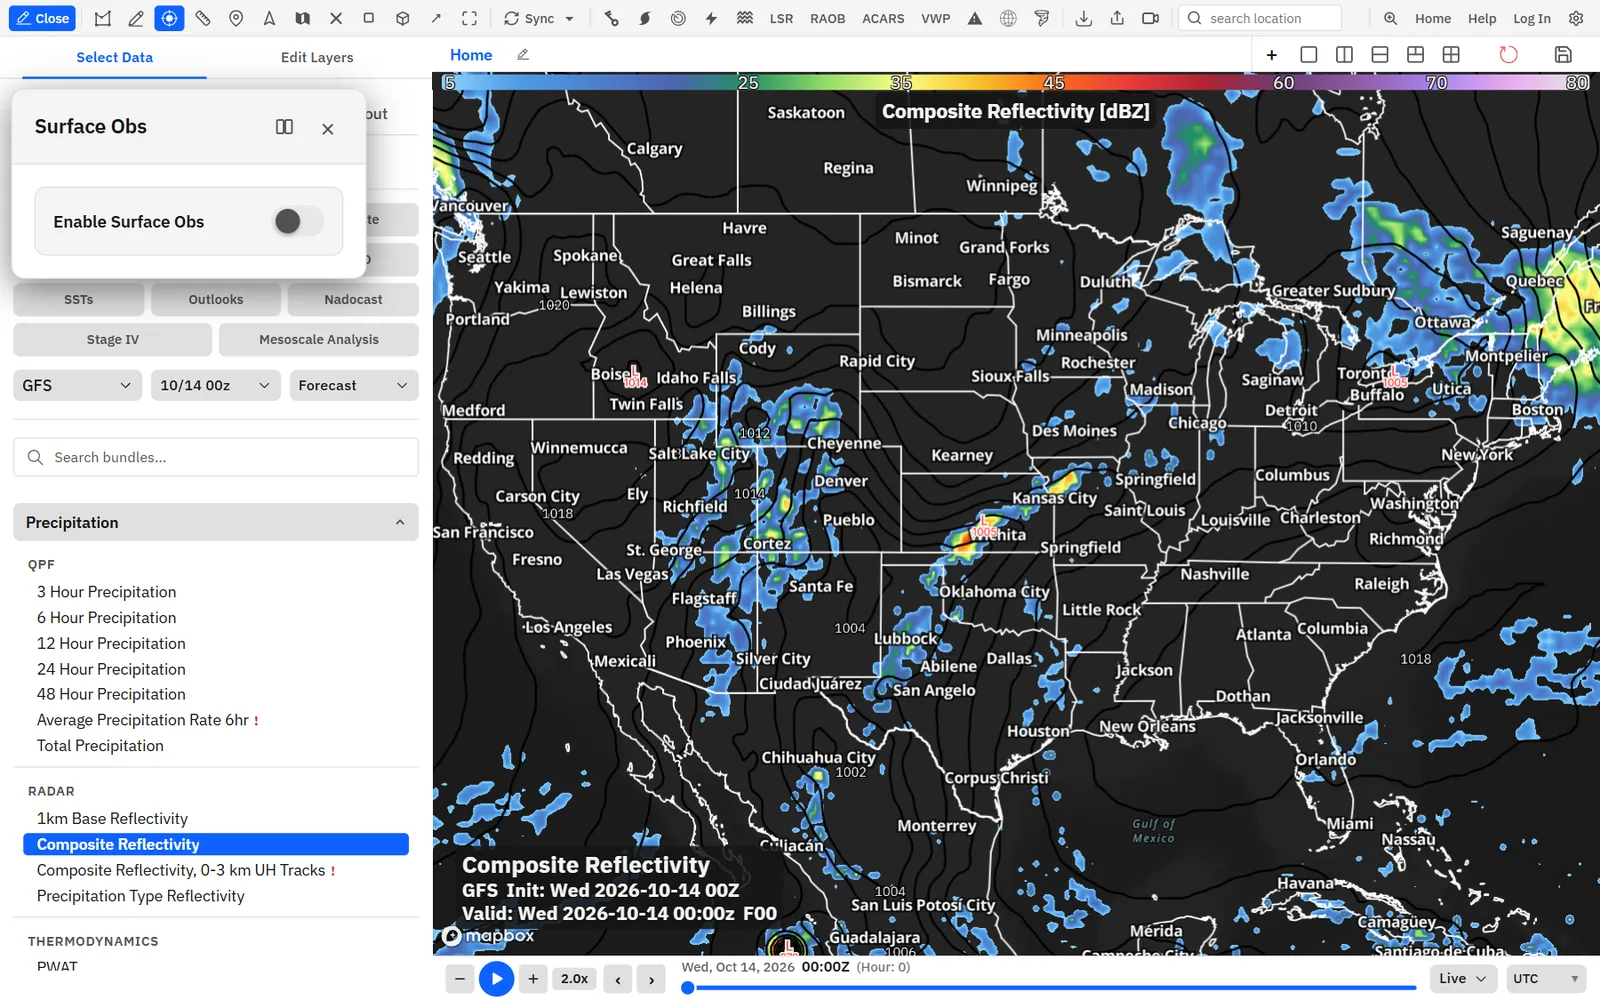
Show me in the app- Single-click Surface obs on the toolbar.
- Turn on Enable Surface Obs.
- Under Networks, pick Both, ASOS or RAWS.
- Under Display Mode, keep Station Plots or pick one variable, such as Wet Bulb or Relative Humidity.
- For a single variable, click Load Colormap to color the stations with your own colormap.
- Hover a station for its latest readings. Click it for an ASOS Meteogram of about the last 24 hours.
Tips
- Turn on Raw METAR under Popup fields to show the raw report when you hover a station.
- Raise Station Spacing to thin out crowded stations when you zoom out.
- Double-click Surface obs to turn the stations on or off without opening the settings.
Local storm reports
Hail, wind, tornado, flood and snow reports from the NWS, plus CoCoRaHS rain gauges.
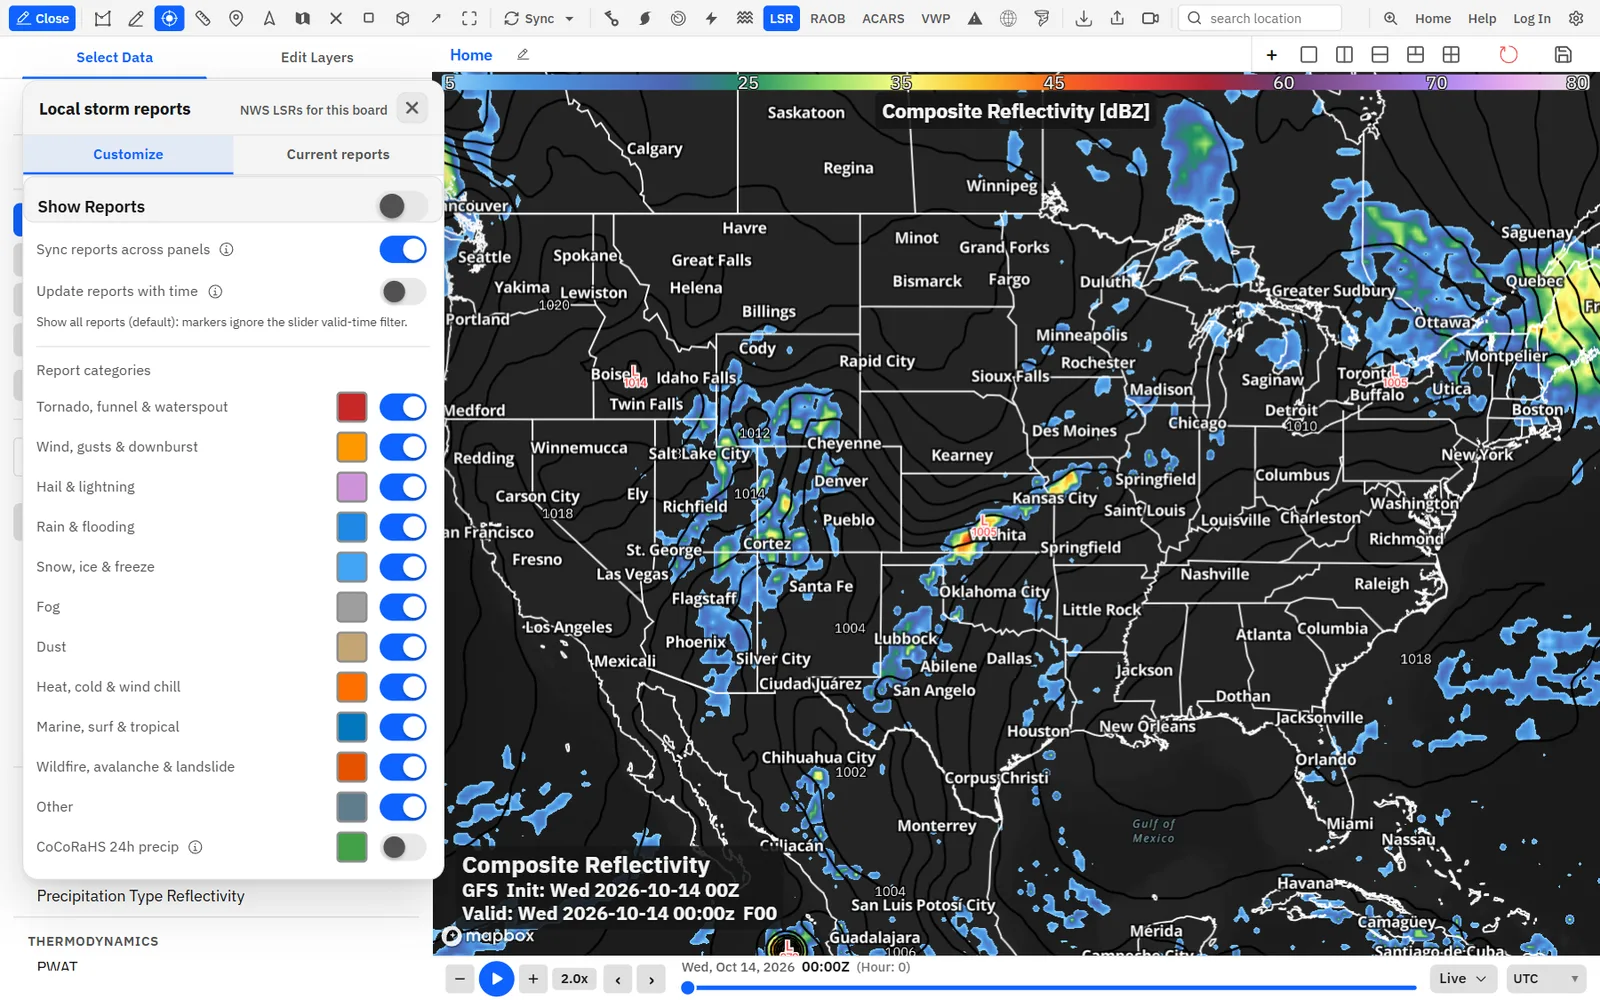
Show me in the app- Single-click LSR on the toolbar.
- Turn on Show Reports.
- Pick a Time window, from 15 minutes to All reports.
- Under Report categories, turn categories on or off. Turn on CoCoRaHS 24h precip to add the gauges.
- Pick a Marker style and set the Marker density.
- Click a report on the map for its magnitude, location and remarks.
Tips
- The Current reports tab lists every report. Search it, then click a report to fly to it.
- Turn on Update reports with time to show each report only once the time slider reaches it.
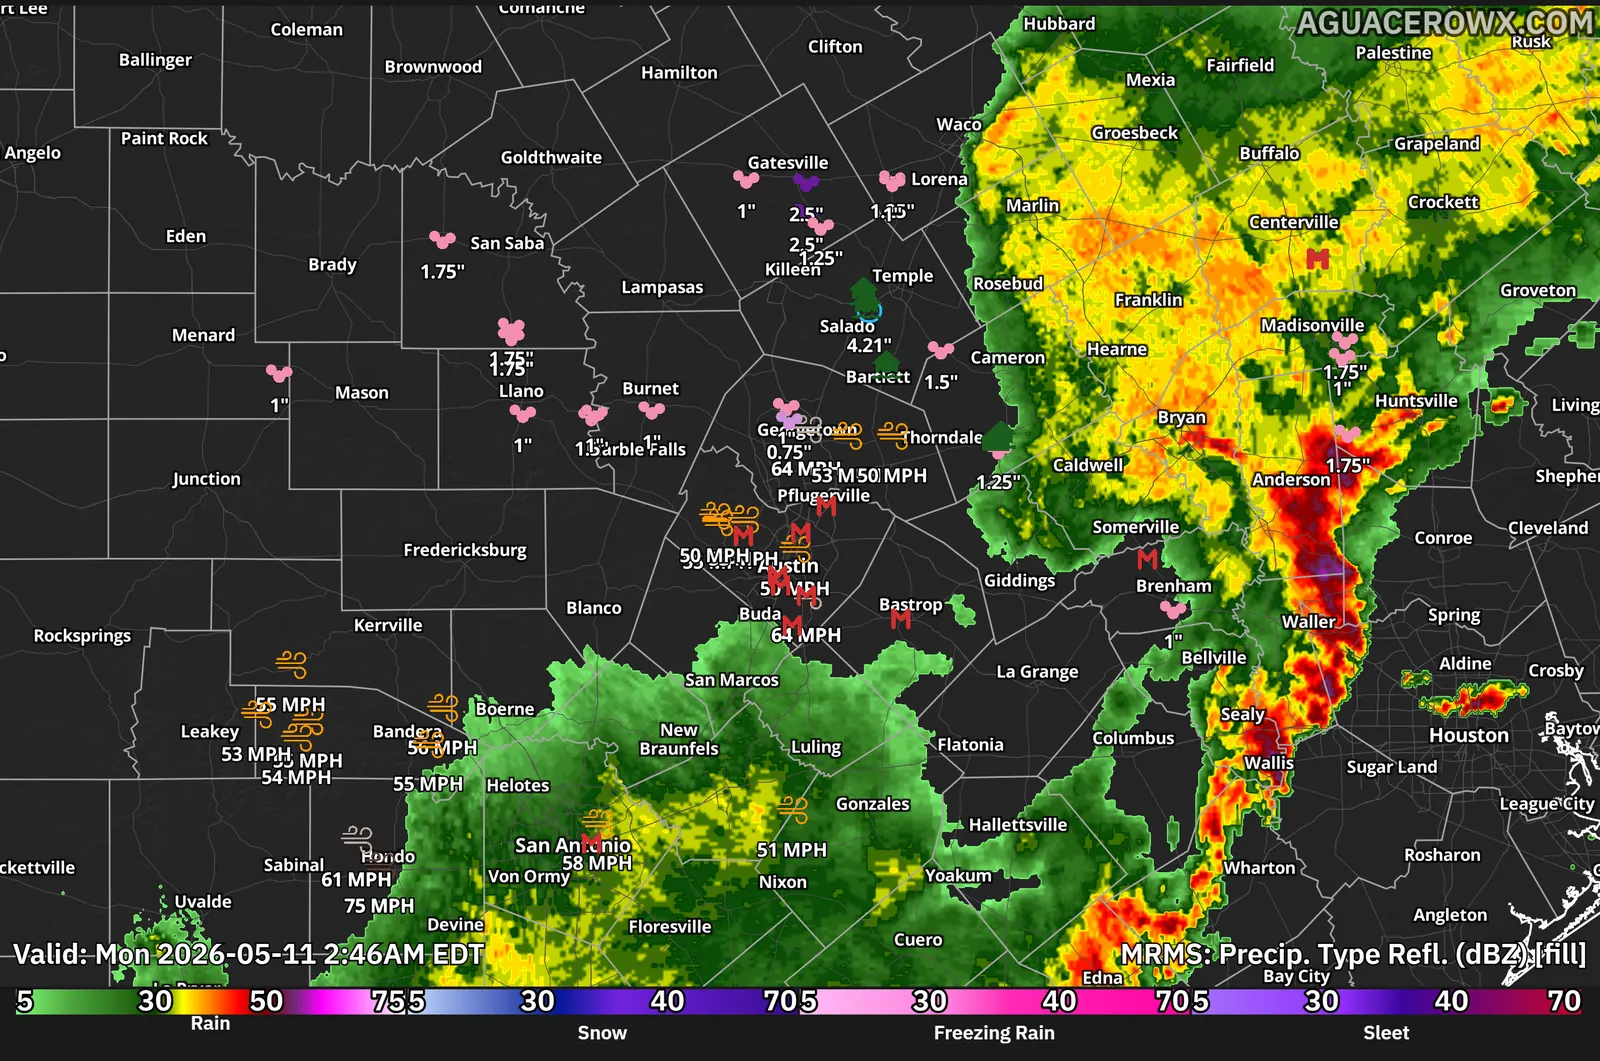
The Custom marker style, which uses your own icons, needs Professional.
River and stream gauges
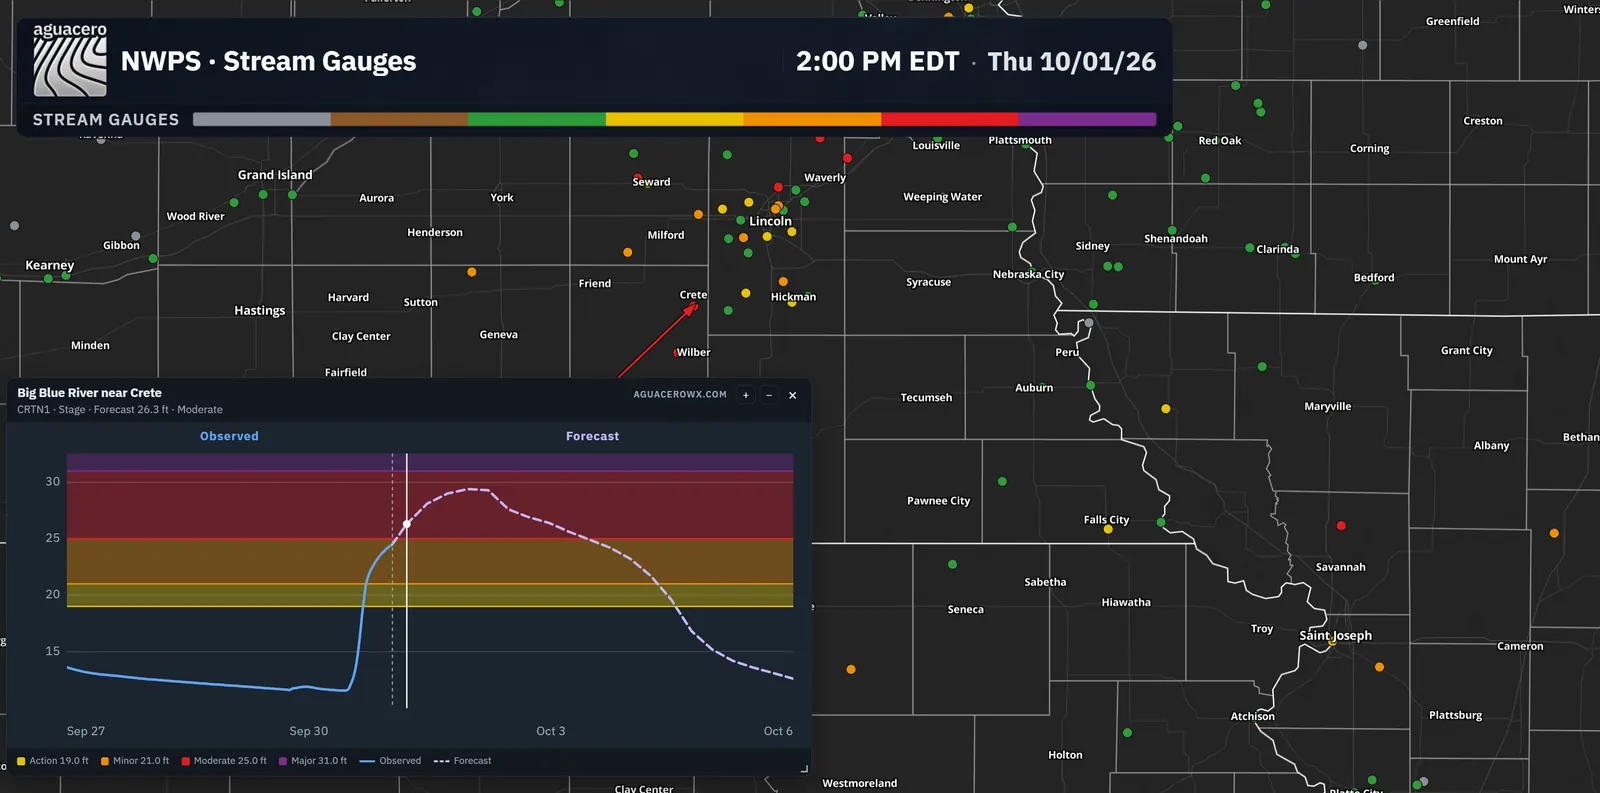
NWPS river and tide gauges colored by flood category. Click one for its observed and forecast hydrograph.
Show me in the app- Single-click Stream gauges on the toolbar.
- Turn on Enable stream gauges.
- Under Time, choose Current observations, or Follow slider to color gauges by the stage at the slider time, including the forecast.
- Under Flood categories, turn off the categories you want to hide.
- Click a gauge to open its hydrograph.
Tips
- Scroll to zoom the hydrograph and drag to pan. Click Reset to zoom back out.
- Right-click the hydrograph to copy or download it.
RTMA
Real-Time Mesoscale Analysis surface fields, such as temperature, dew point, wind gusts and fire weather indices.
Show me in the app- Open the sidebar on Select Data.
- Click RTMA in the data type filter.
- Click a bundle in the list to load it.
- To add one field instead, open Edit Layers, click Add Layer, then RTMA, and pick a product such as 2m Temperature.
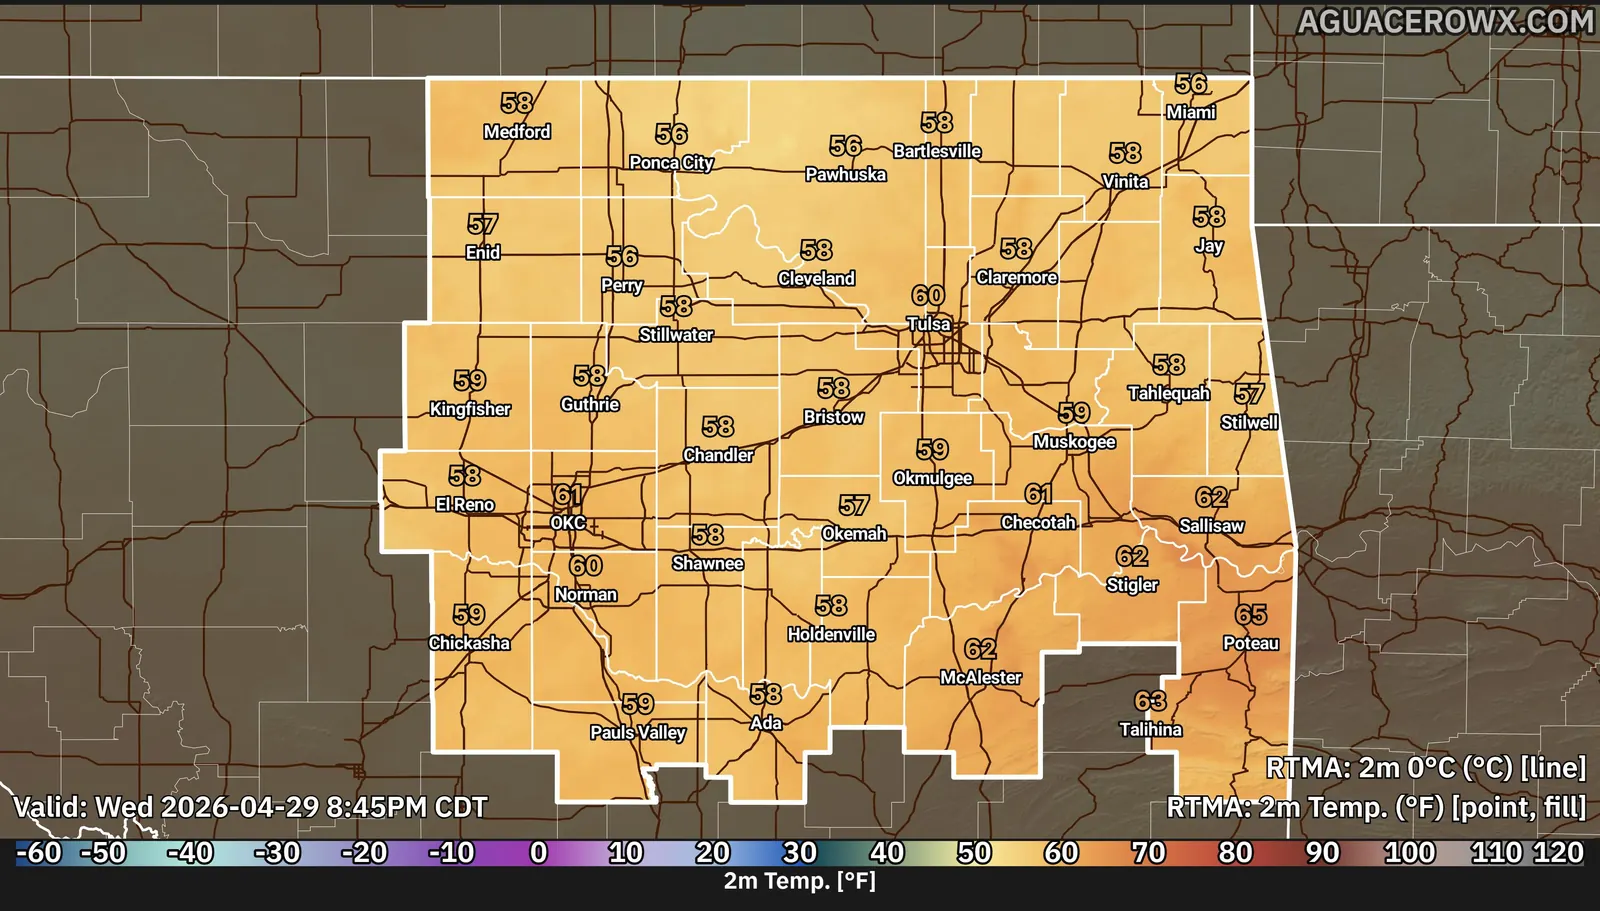
Every RTMA product is on every plan. Free loops 1 hour of RTMA, and longer loops need a paid plan.
Stage IV precipitation
NCEP multisensor precipitation at about 4.8 km, with totals from 1 hour to a week.
Show me in the app- Open the sidebar on Select Data.
- Click Stage IV in the data type filter.
- Click a bundle in the list to load it.
- To change the total, open Edit Layers, click the layer’s field name and pick another, such as 24 Hour Precipitation or 1 Week Precipitation.
Flash flood guidance
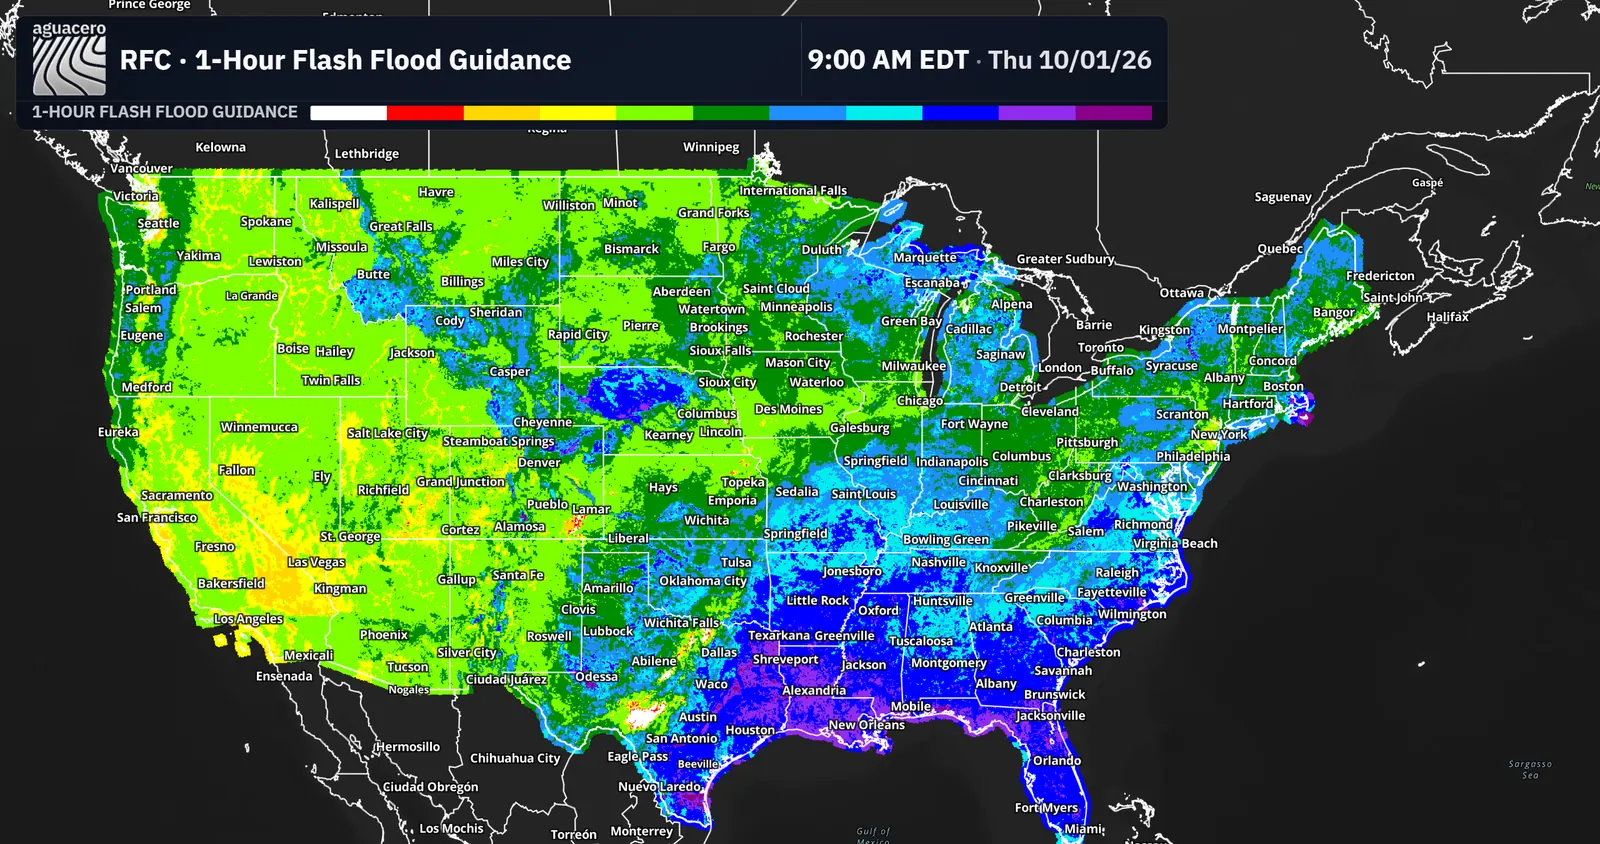
River Forecast Center guidance: how much rain it takes to cause flash flooding, for 1, 3 and 6 hours across CONUS and 12 hours in the Mid-Atlantic.
Show me in the app- Click NOAA data on the toolbar to open Forecast Products.
- Click the RFC tab.
- Under Flash Flood Guidance, turn on 1 Hour, 3 Hour, 6 Hour or 12 Hour.
- Click the map to read the guidance at a point.
Tips
- The Outlooks data type in the sidebar has the same picker. A product picked there replaces the layers on the panel.
National Water ModelEnthusiast
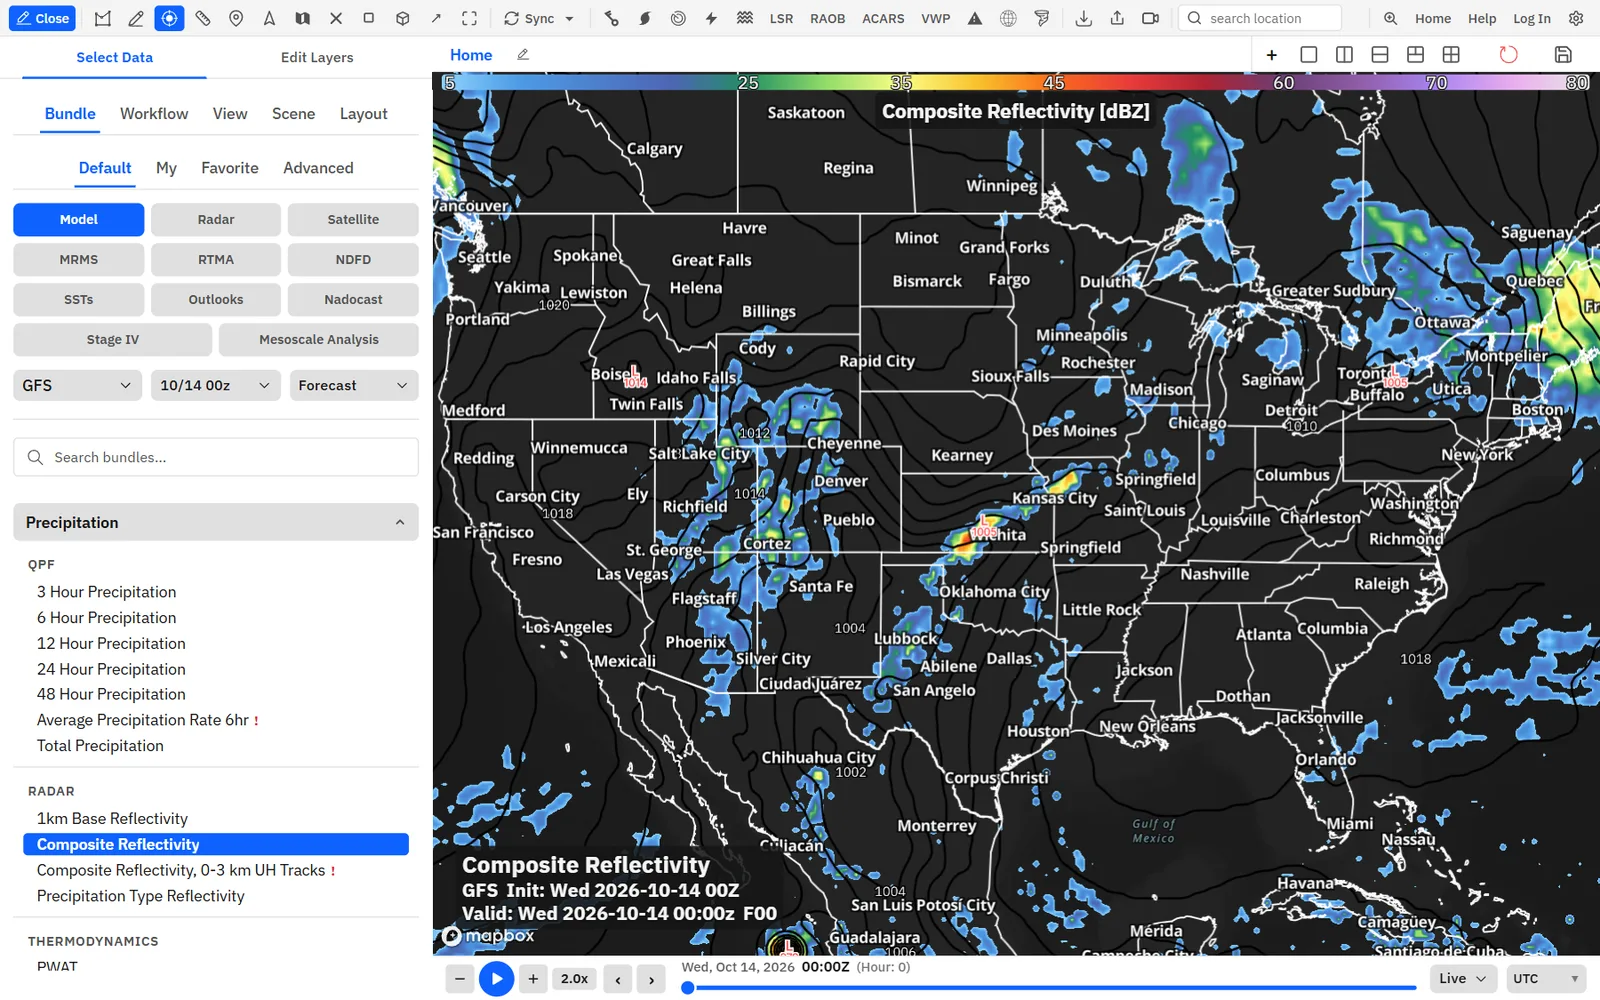
Short-, medium- and long-range streamflow, soil, snow and runoff for 2.7 million river reaches.
Show me in the app- In the sidebar, click the model menu, which shows the current model’s name, to open the model picker.
- Type NWM in Search models....
- Pick NWM Short Range, NWM Medium Range or NWM Long Range.
- Open Edit Layers, click Add Layer, then Model and Hydrology.
- Pick a field, such as Streamflow, Snow Water Equivalent or Top-Layer Soil Saturation.
Short range is an 18-hour hourly forecast. Medium-range streamflow is hourly out to 10 days, and long-range streamflow is every 6 hours out to 30 days. The NWM models are not in the Free model list.
Sea surface temperature
Sea surface temperature, its anomaly and change, and tropical cyclone heat potential from three ocean analyses.
Show me in the app- Open the sidebar on Select Data.
- Click SSTs in the data type filter.
- Pick a source: CRW (NOAA Coral Reef Watch), CDAS or ARMOR3D.
- Click a bundle in the list to load it.
- To add one field instead, use Add Layer, then SSTs, and pick a product such as 7-Day SST Change or Tropical Cyclone Heat Potential.
Tips
- Draw a cross section over an SST layer to slice the ocean below the surface. See the Soundings guide.