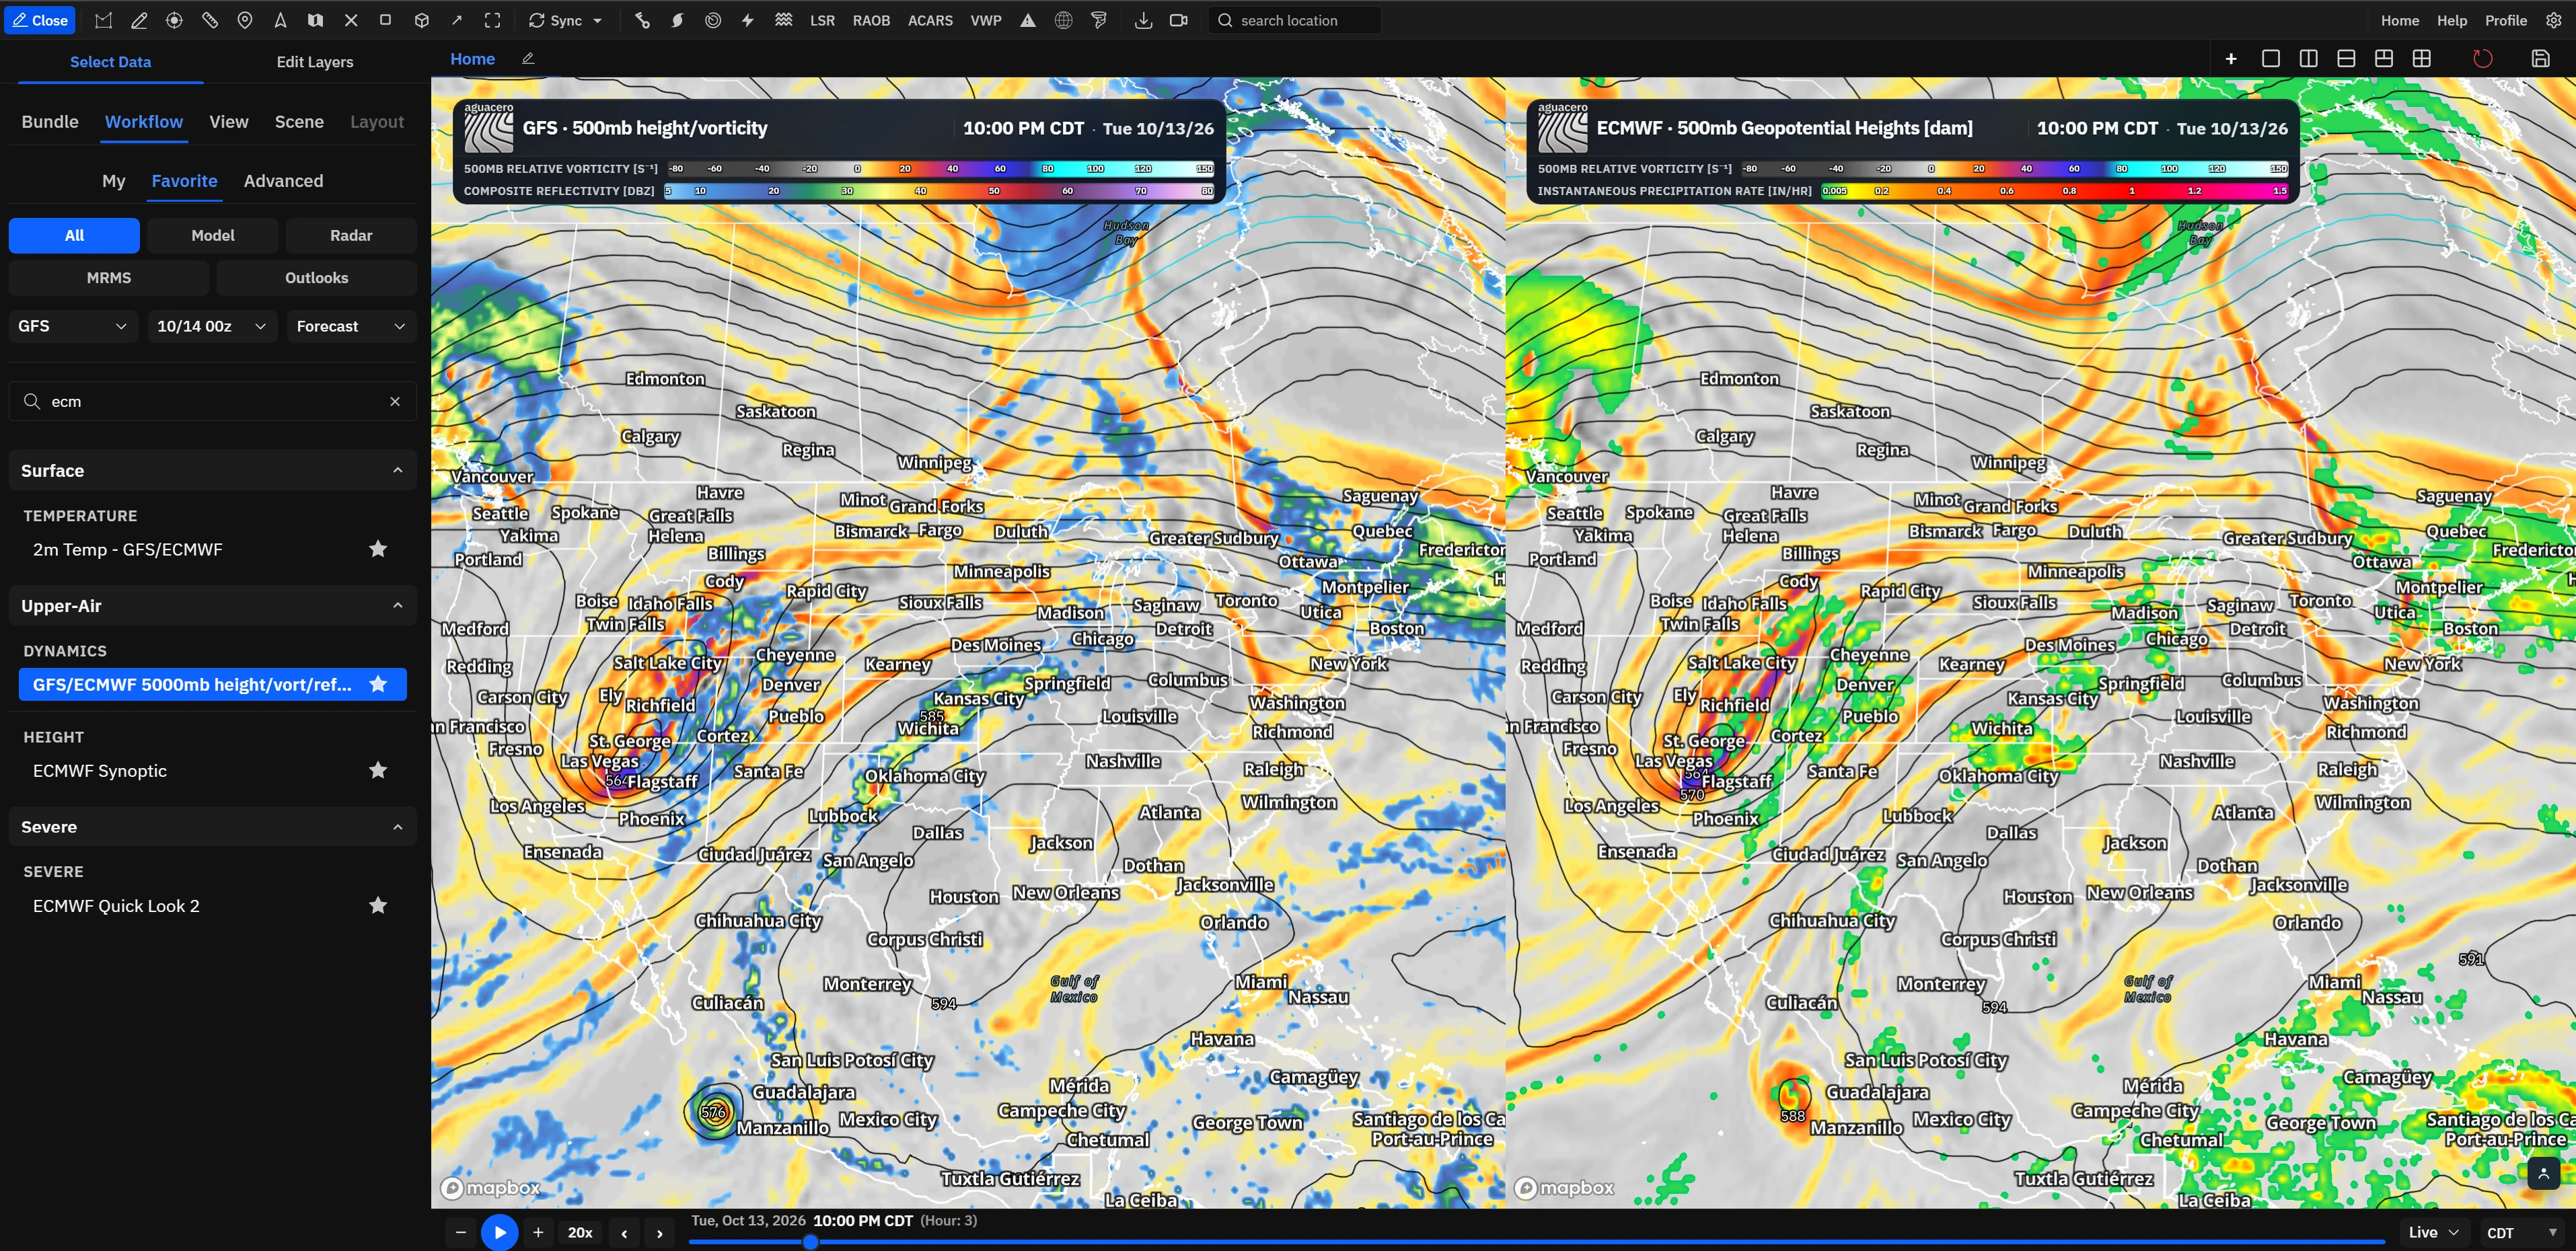
100+ forecast models
HRRR, GFS, ECMWF, NAM, RAP, RRFS, ICON, UKMET, GDPS, ARPEGE and more in one picker, with new runs as they land. 26 models are free, including HRRR, GFS, NAM, RAP and RRFS.
Features
Every model, radar product, sounding, alert, archive and broadcast tool we have shipped, in one place. Search for what you need, or browse by area.
All 134 features
17 features
125 entries in the model picker: global, regional, convection-allowing, ensemble, AI, ocean, air-quality and seasonal guidance. Free has 26 models; Enthusiast and up have every one.
HRRR, GFS, ECMWF, NAM, RAP, RRFS, ICON, UKMET, GDPS, ARPEGE and more in one picker, with new runs as they land. 26 models are free, including HRRR, GFS, NAM, RAP and RRFS.
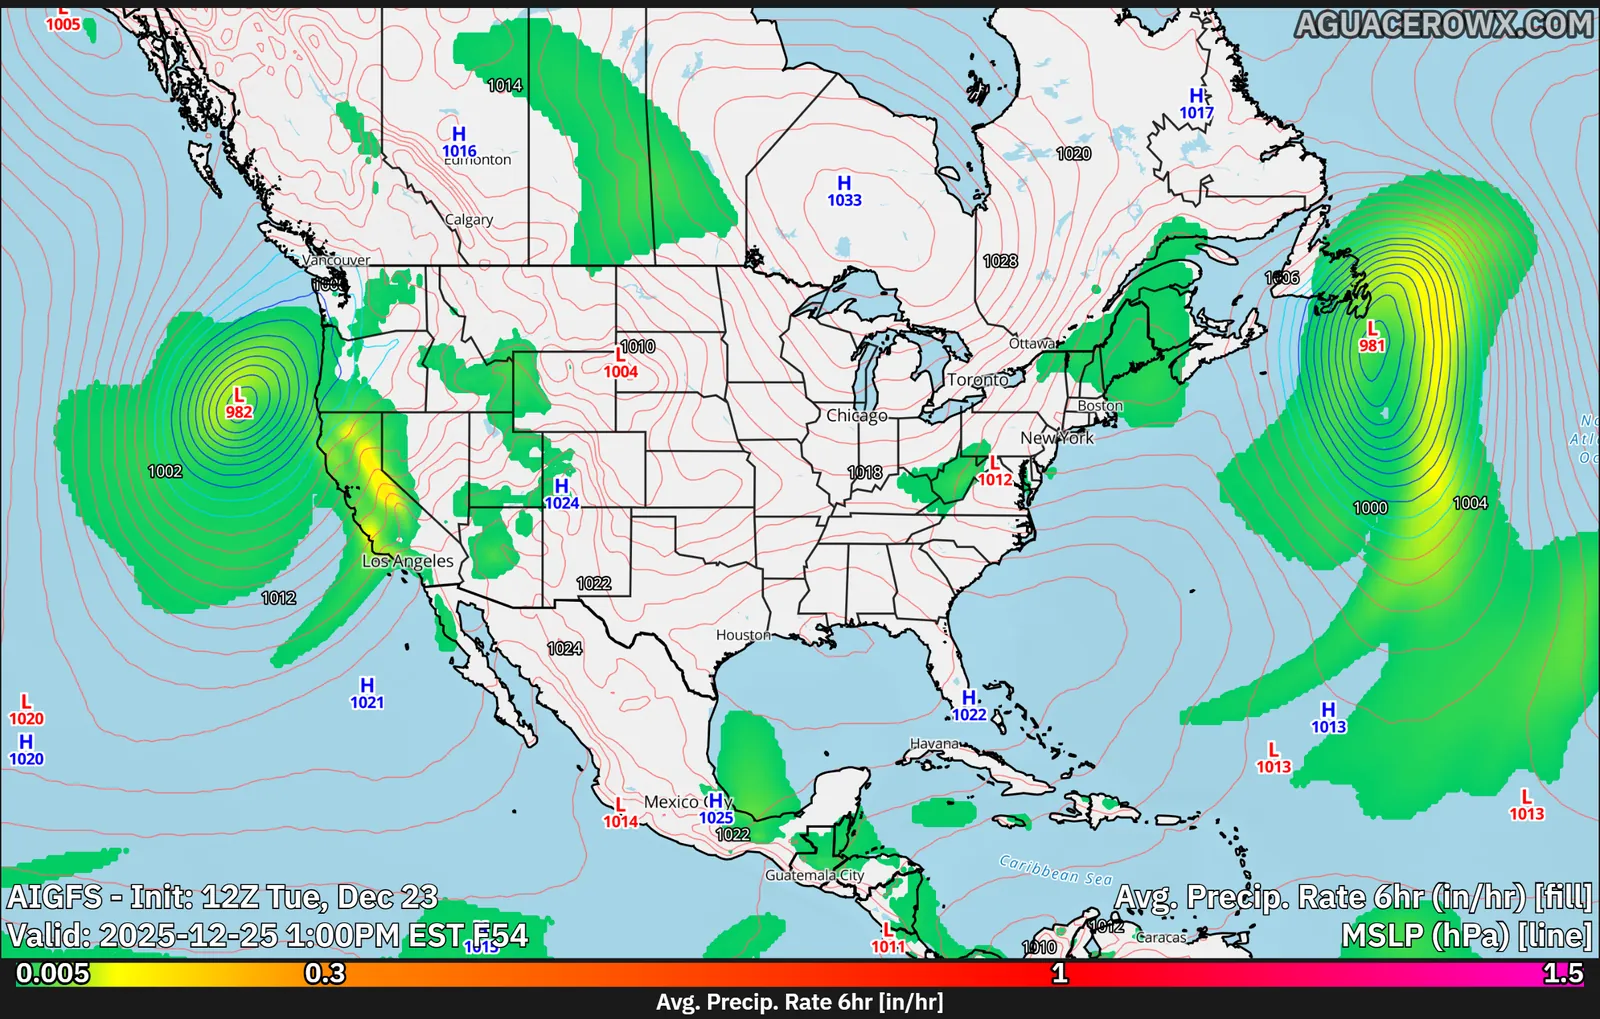
ECMWF-AIFS, WeatherNext 2, AI-GFS, AI-GEFS, AICON, GEM-L, Aurora and Pangu-Weather, several with precipitation type and snowfall. AI-GFS, AI-GEFS and WeatherNext are on the Free plan.
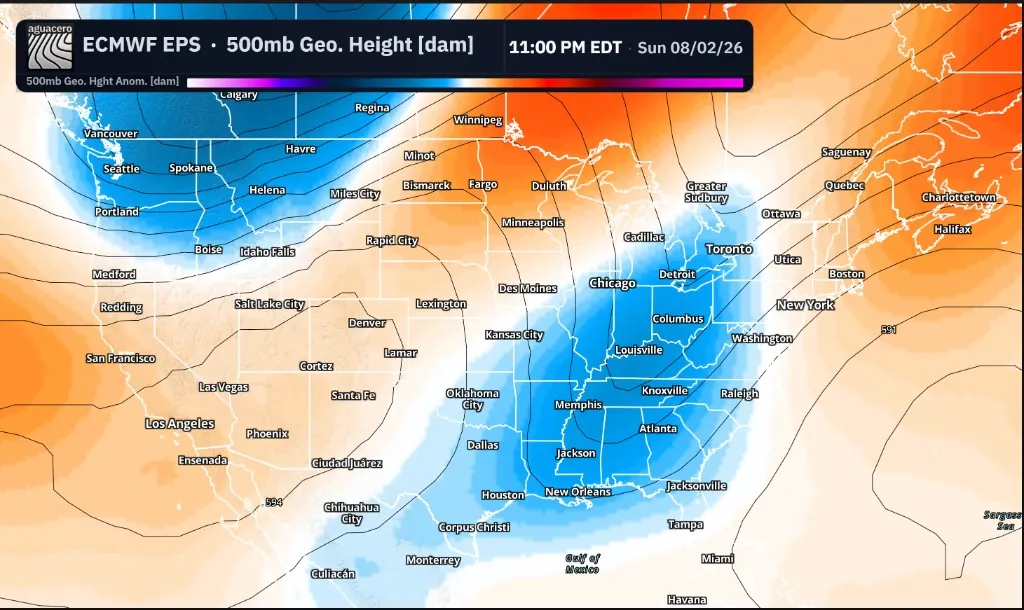
GEFS, GEPS, ECMWF EPS, ECMWF-AIFS-EPS, ICON-EPS, NAEFS, HREF, REFS, MOGREPS, REPS and more for probabilistic guidance.
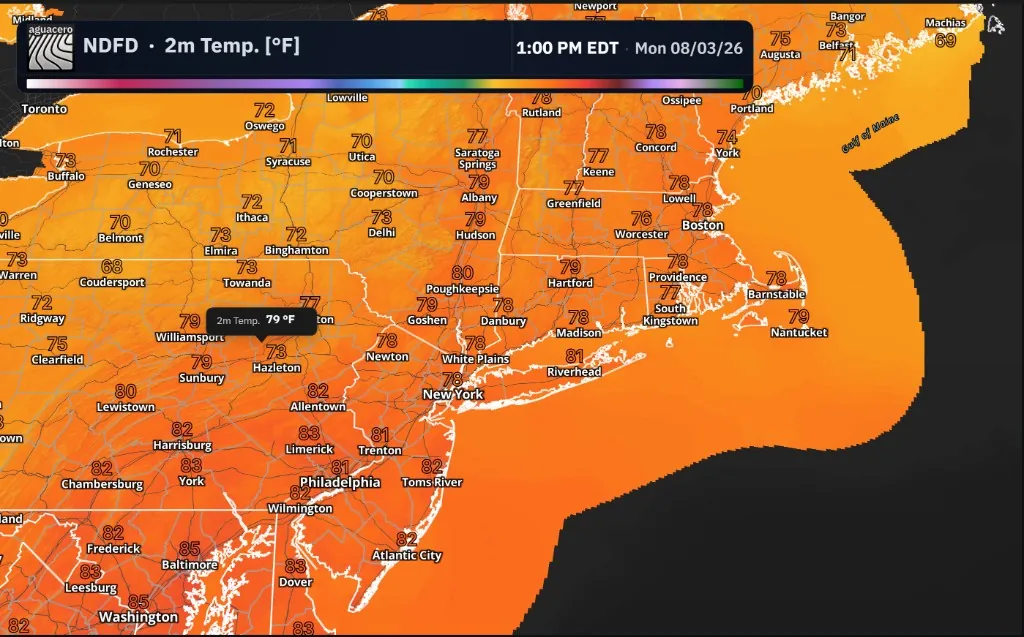
The National Blend of Models every hour, and the official NWS NDFD forecast grids at 2.5 km.
EnthusiastNew in 6.9How to use
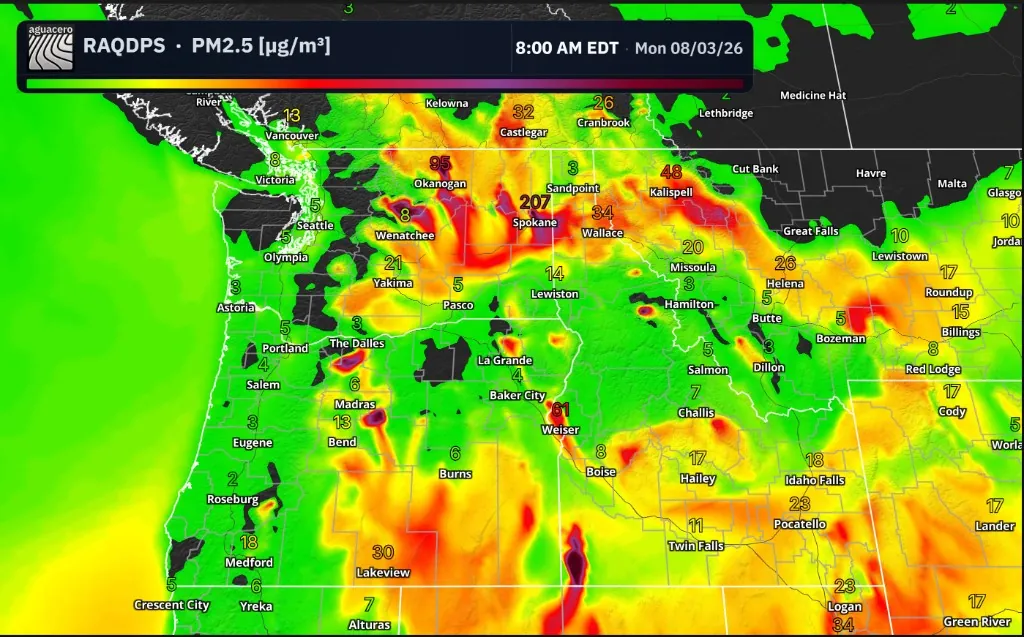
AQM, RAQDPS, CAMS Global and Regional, ICON-ART, GEFS-Aerosols, SILAM, HYSPLIT dust and WRF-Chem, plus smoke on supported models.
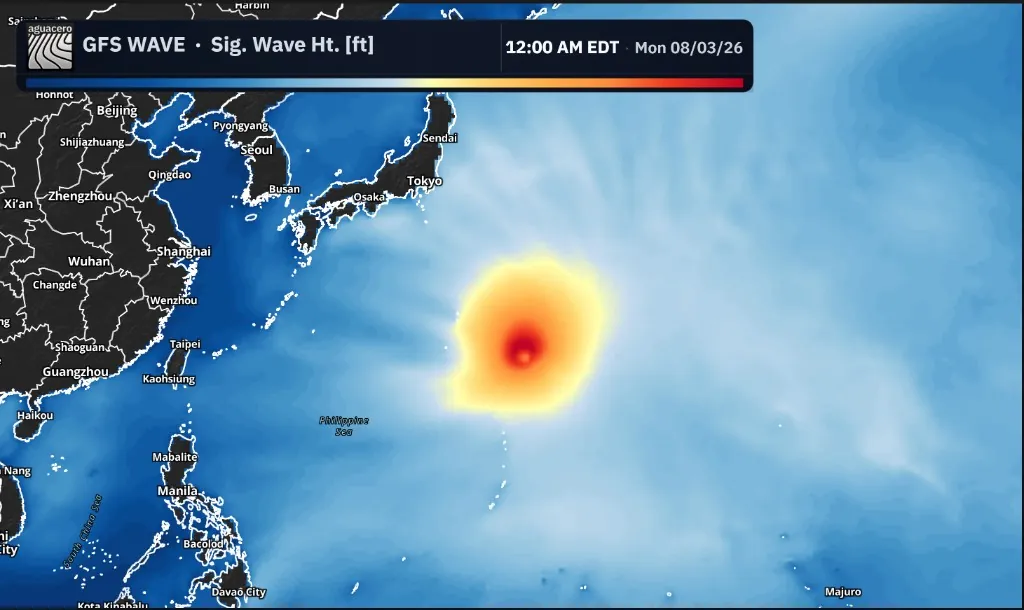
GFS Wave, ECWAM, AIFS Wave, GLWU and RTOFS, plus ETSS, P-Surge and STOFS storm surge guidance.
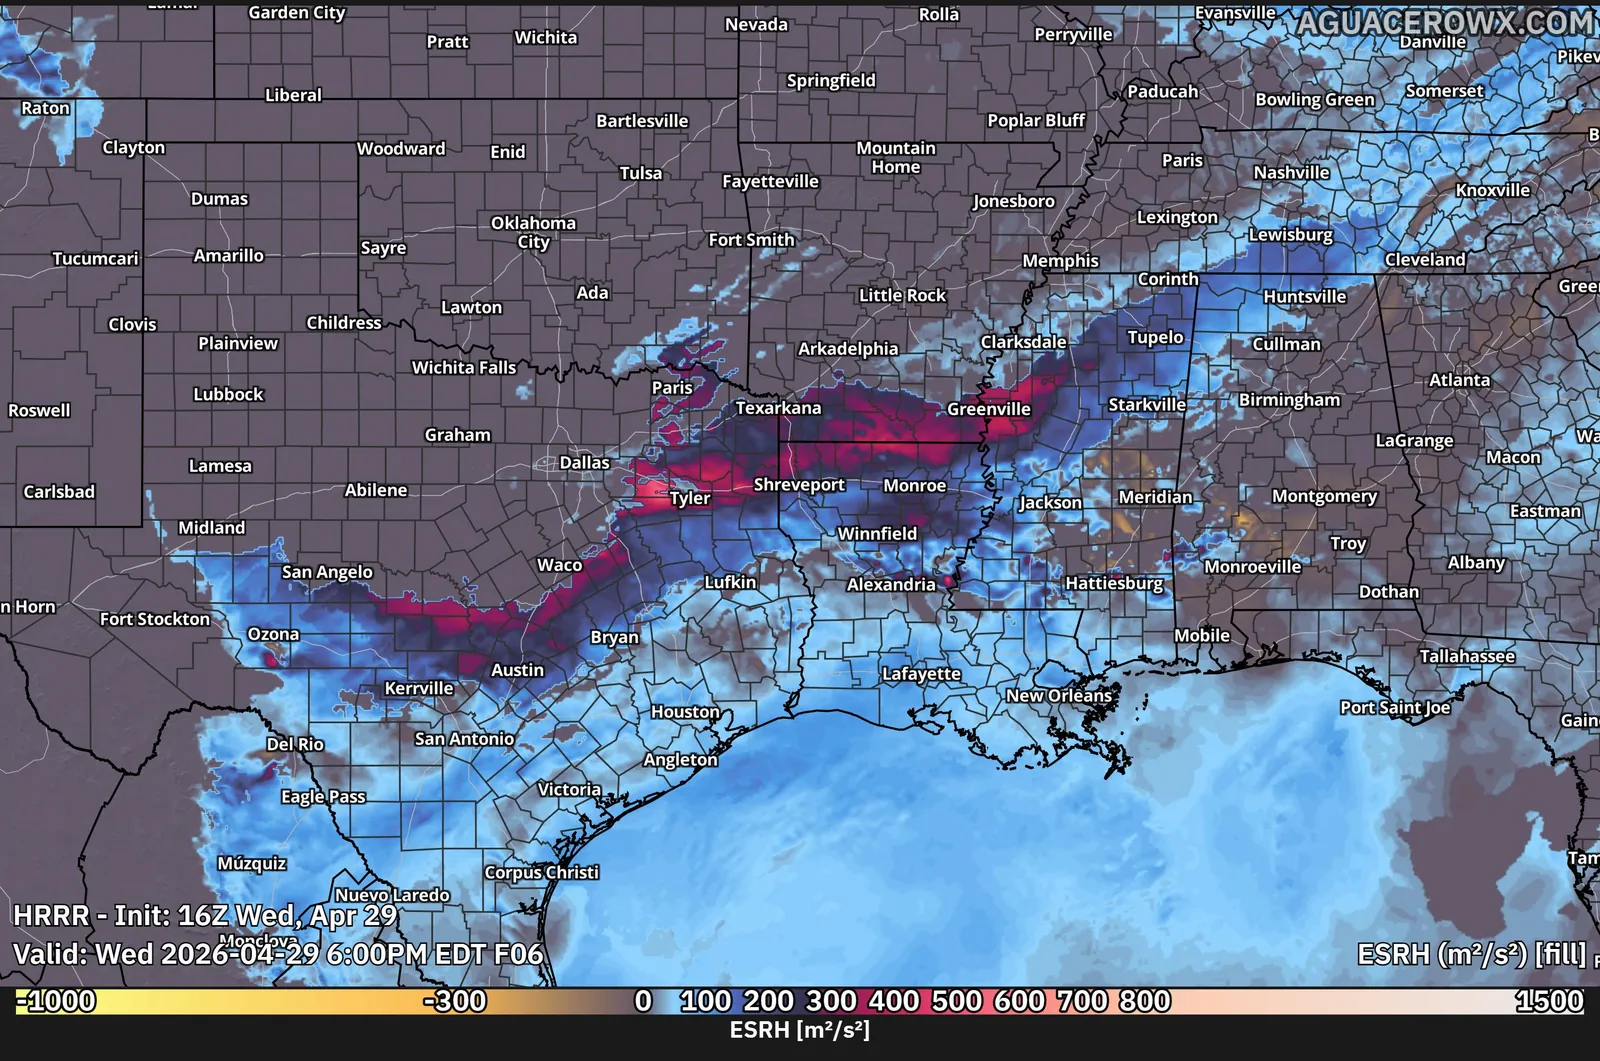
Effective SRH, SHERBE, the Violent Tornado Parameter, the non-supercell tornado parameter, DCAPE, microburst composite and hail on supported models.
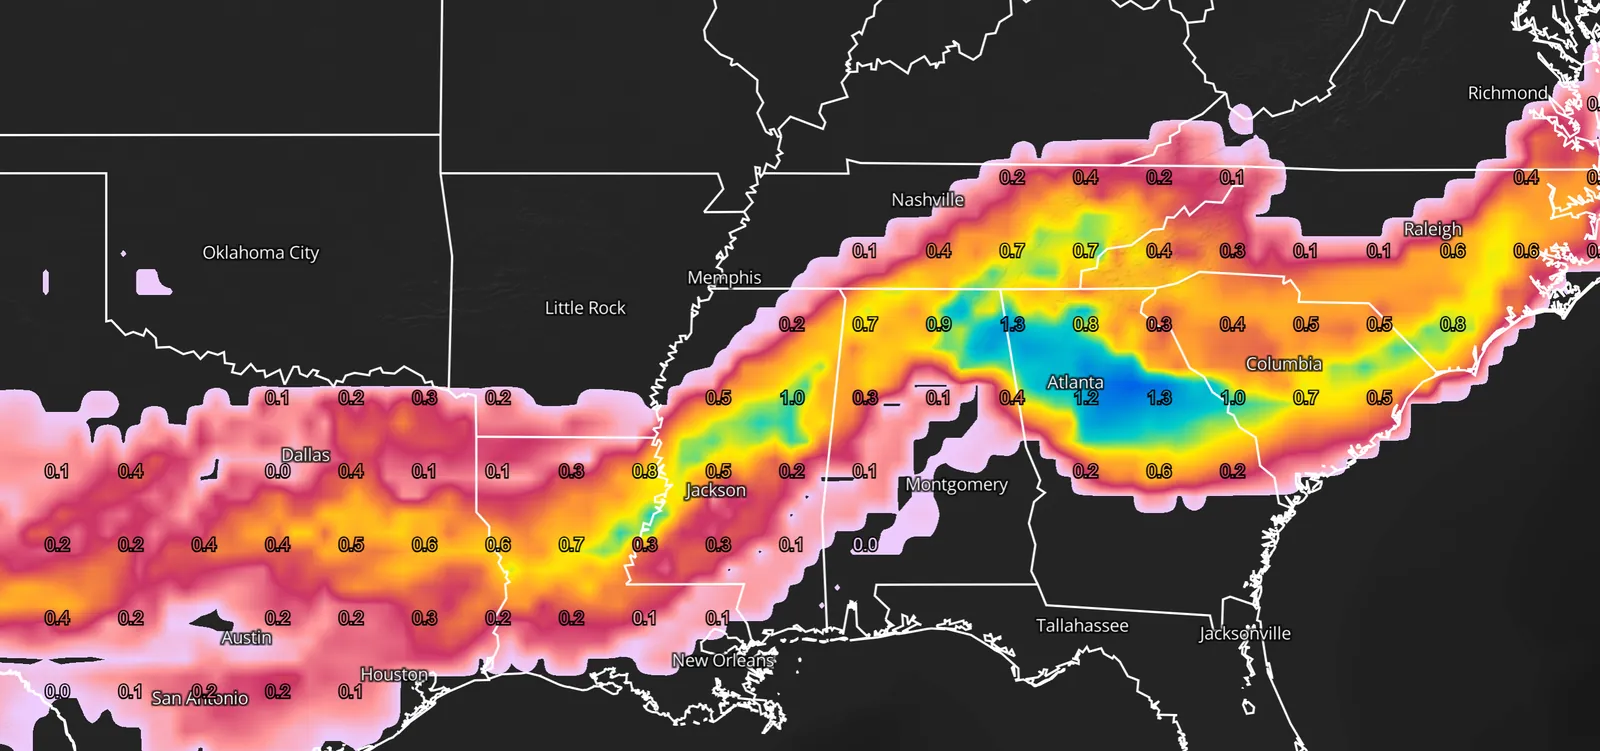
FRAM ice accumulation, precipitation-type reflectivity, snow depth change and dendritic growth zone depth.
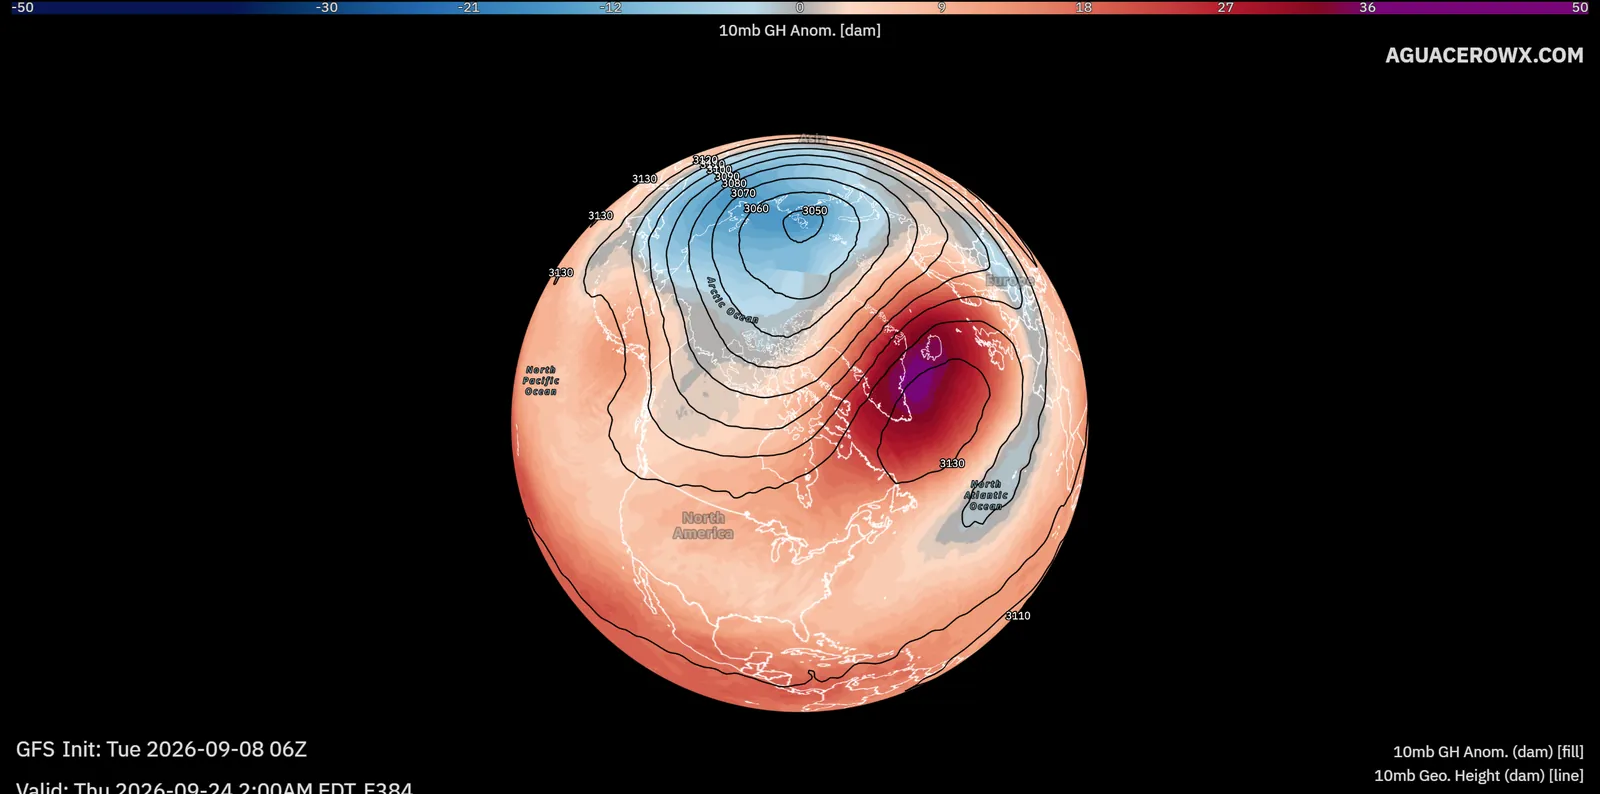
10, 50 and 100 mb temperature, height and wind on global models, with anomalies against 1990–2019 ERA5, for watching the polar vortex.
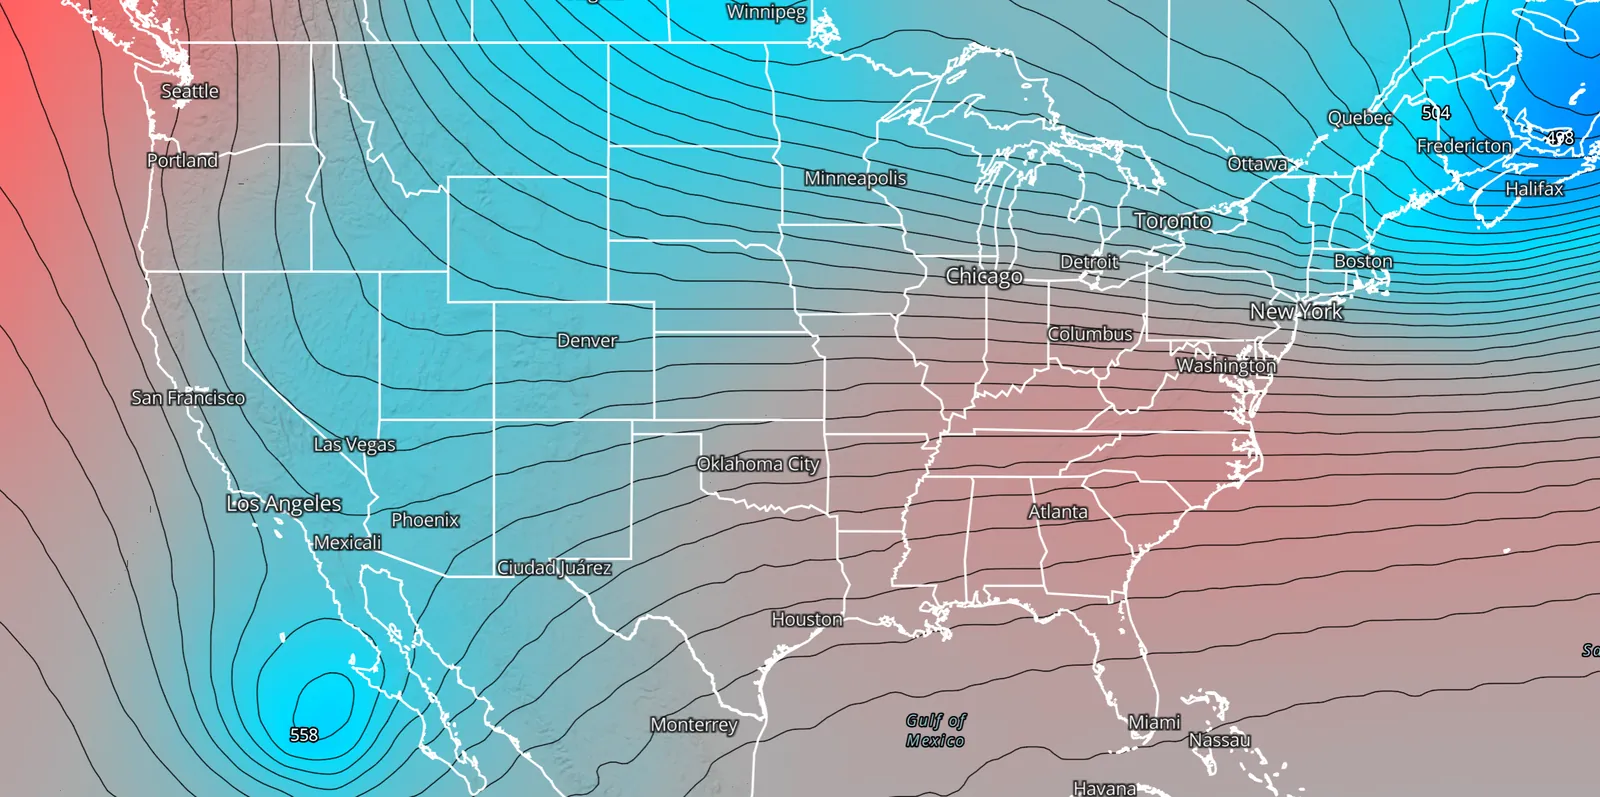
2 m temperature, 500 mb height, PWAT and MSLP anomalies against a 1991–2020 climatology.
HRRR and RRFS (sub-hourly too), NAM 3 km, HRDPS, NSSL MPAS, HRW FV3, WRF-ARW, ICON-D2, AROME and HRRR and NAM for Alaska.
GFS, ECMWF, ICON, UKMO, GDPS, ARPEGE and NAVGEM worldwide, plus regional models such as UKV, HARMONIE, MEPS, AROME-Arctic, ICON-EU and CPTEC.
Hot-Dry-Windy Index and its anomaly, the Red Flag Threat Index and vapor pressure deficit.
Vorticity, Q-vectors, theta-e advection and moisture transport, plus wind, RH and PV on the 290–330 K surfaces.
Type a name, id or category to jump to any model. Green, yellow and red dots show which models can draw your bundle.
Trend steps through runs at one valid time. Compare steps through models at the same time.
11 features
NEXRAD Level II and III, TDWR, MRMS and European radar, flat on the map or in 3D.
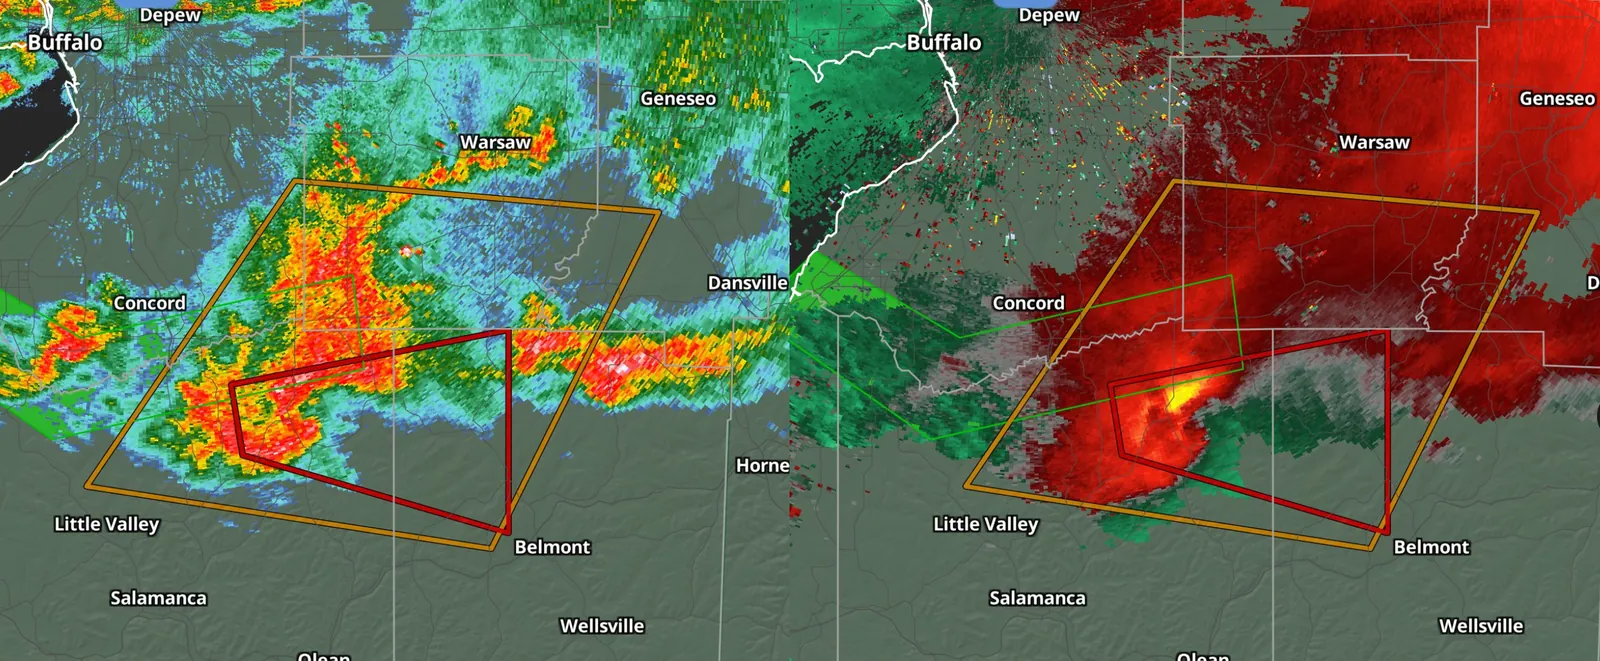
Every WSR-88D and TDWR site with all tilts: reflectivity, velocity, ZDR, CC, KDP and Level III products, with dealiased velocity. Loops run 1 hour on Free and up to 12 on Professional.
ToolbarHow to use
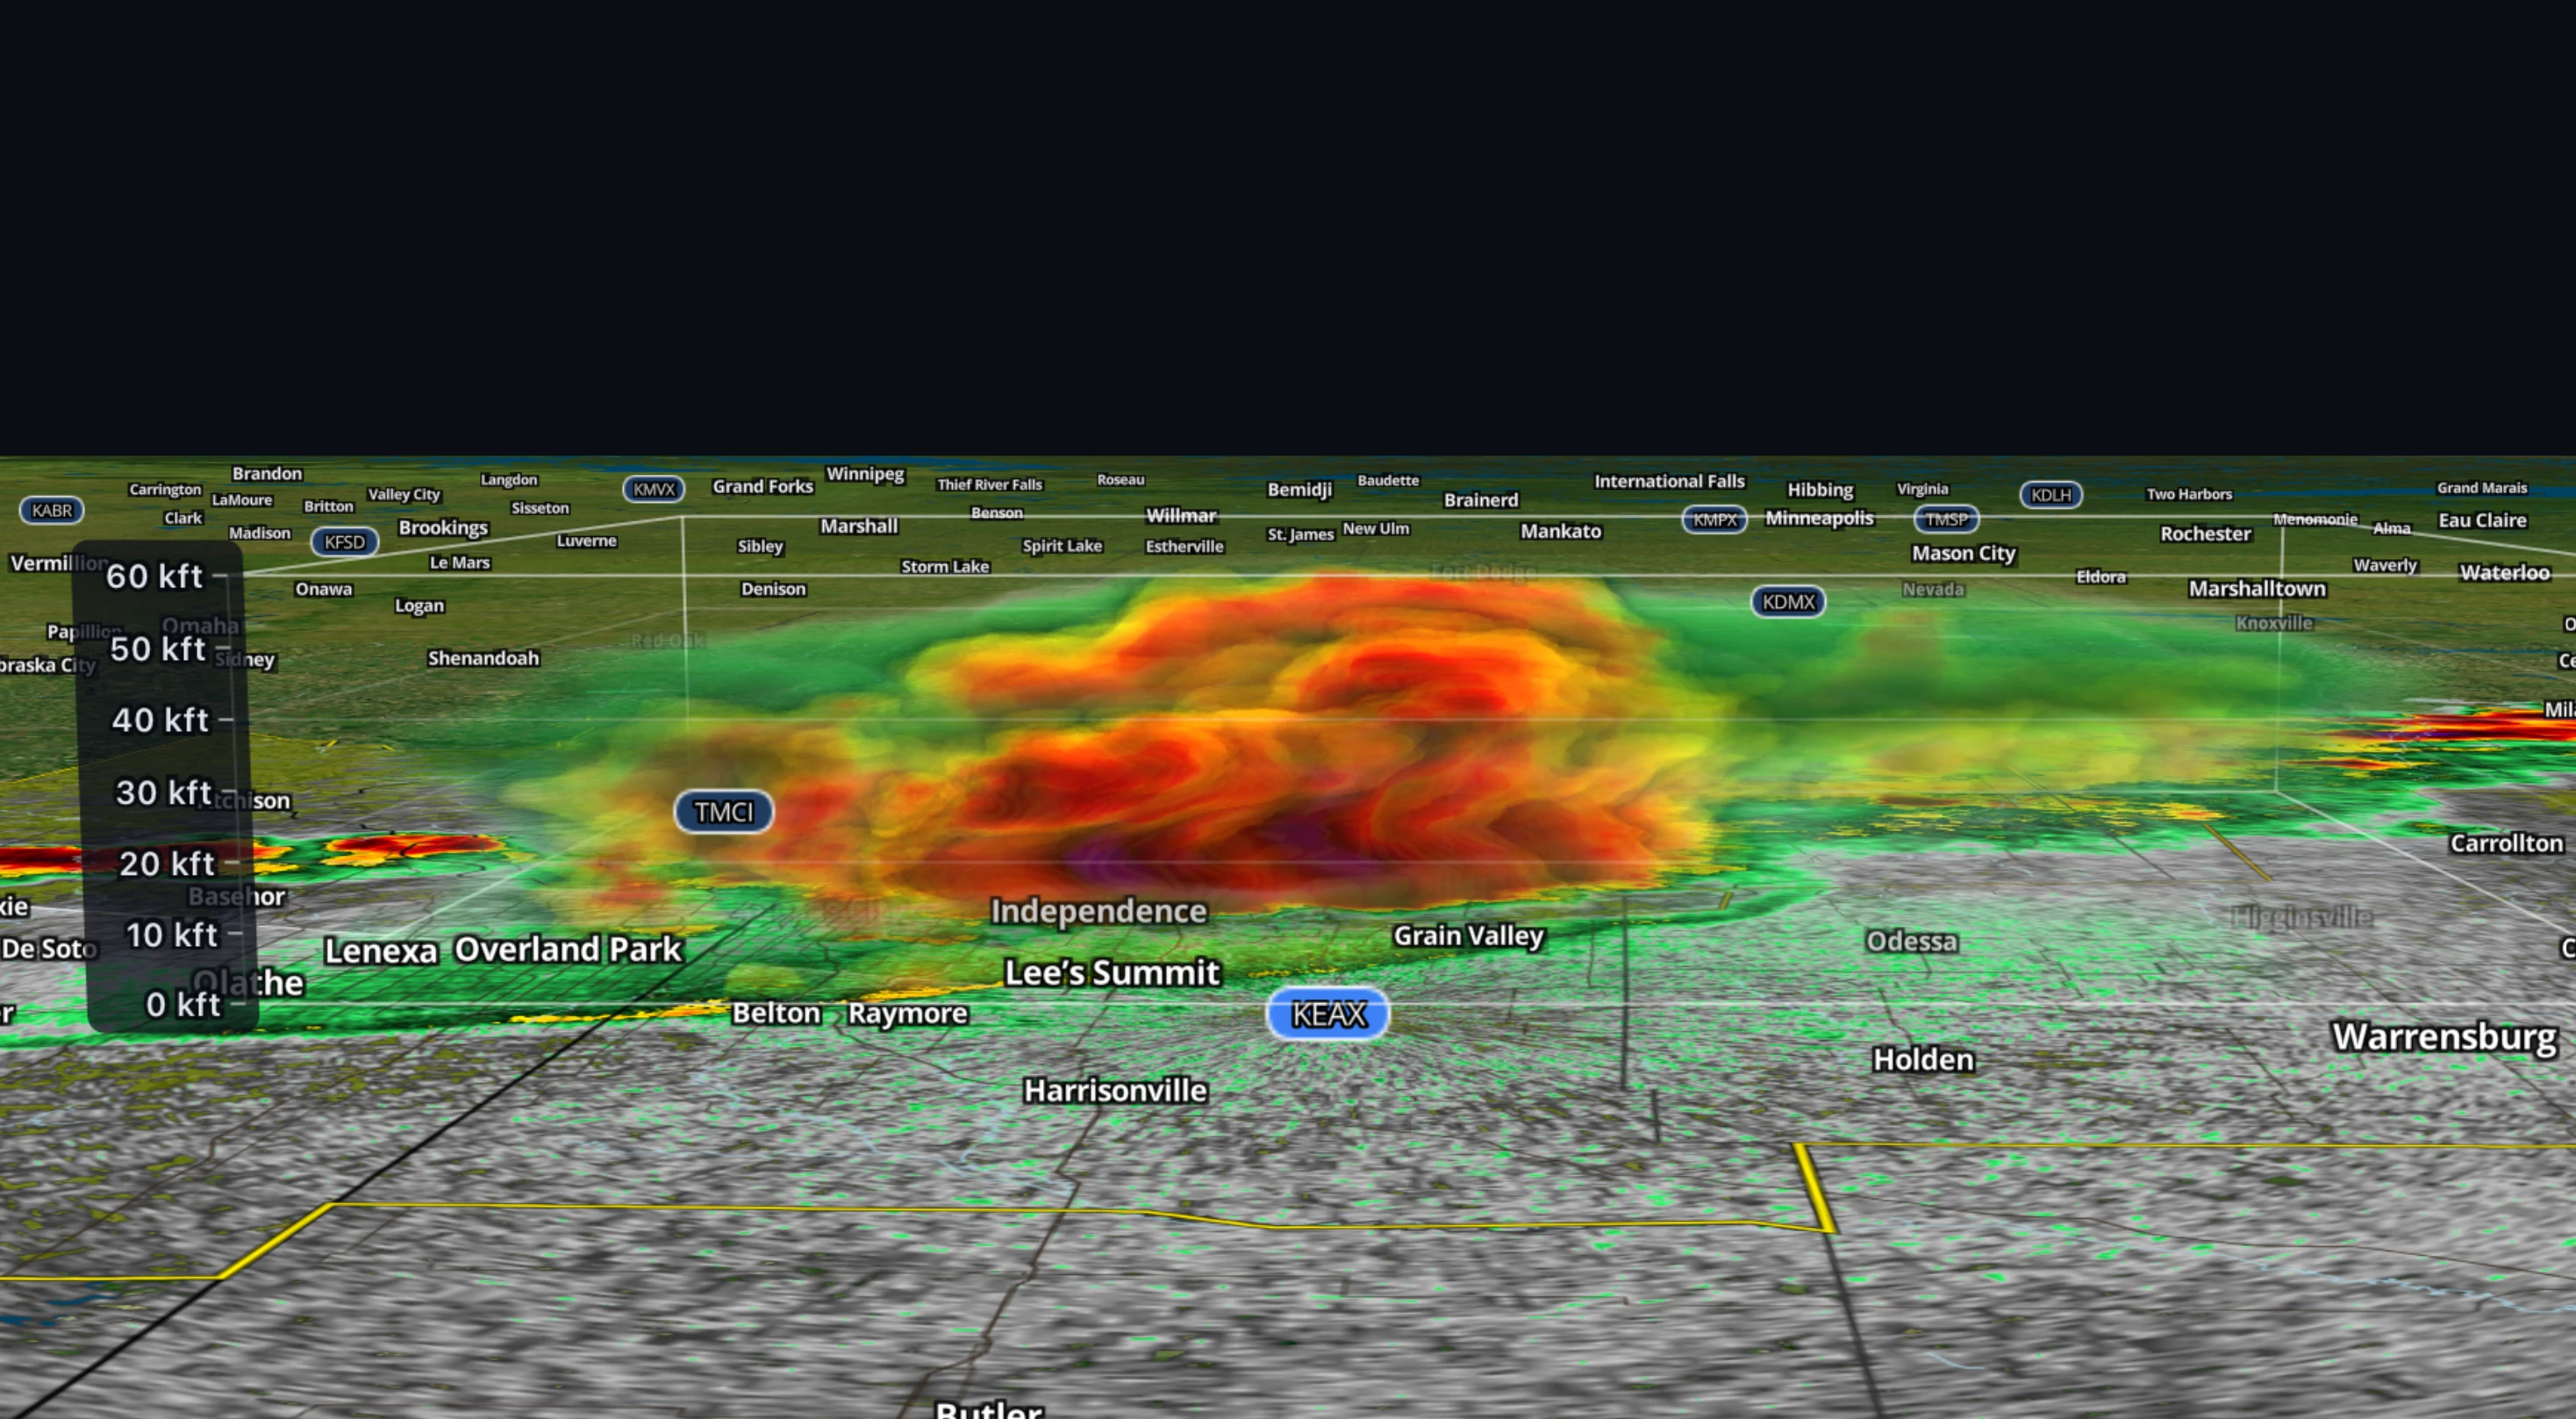
Draw a box (or Alt + drag) to fly around a storm in 3D. Lit, max, solid and cloud renders, velocity, model isotherms and a kft height scale.
ProfessionalToolbarHow to use
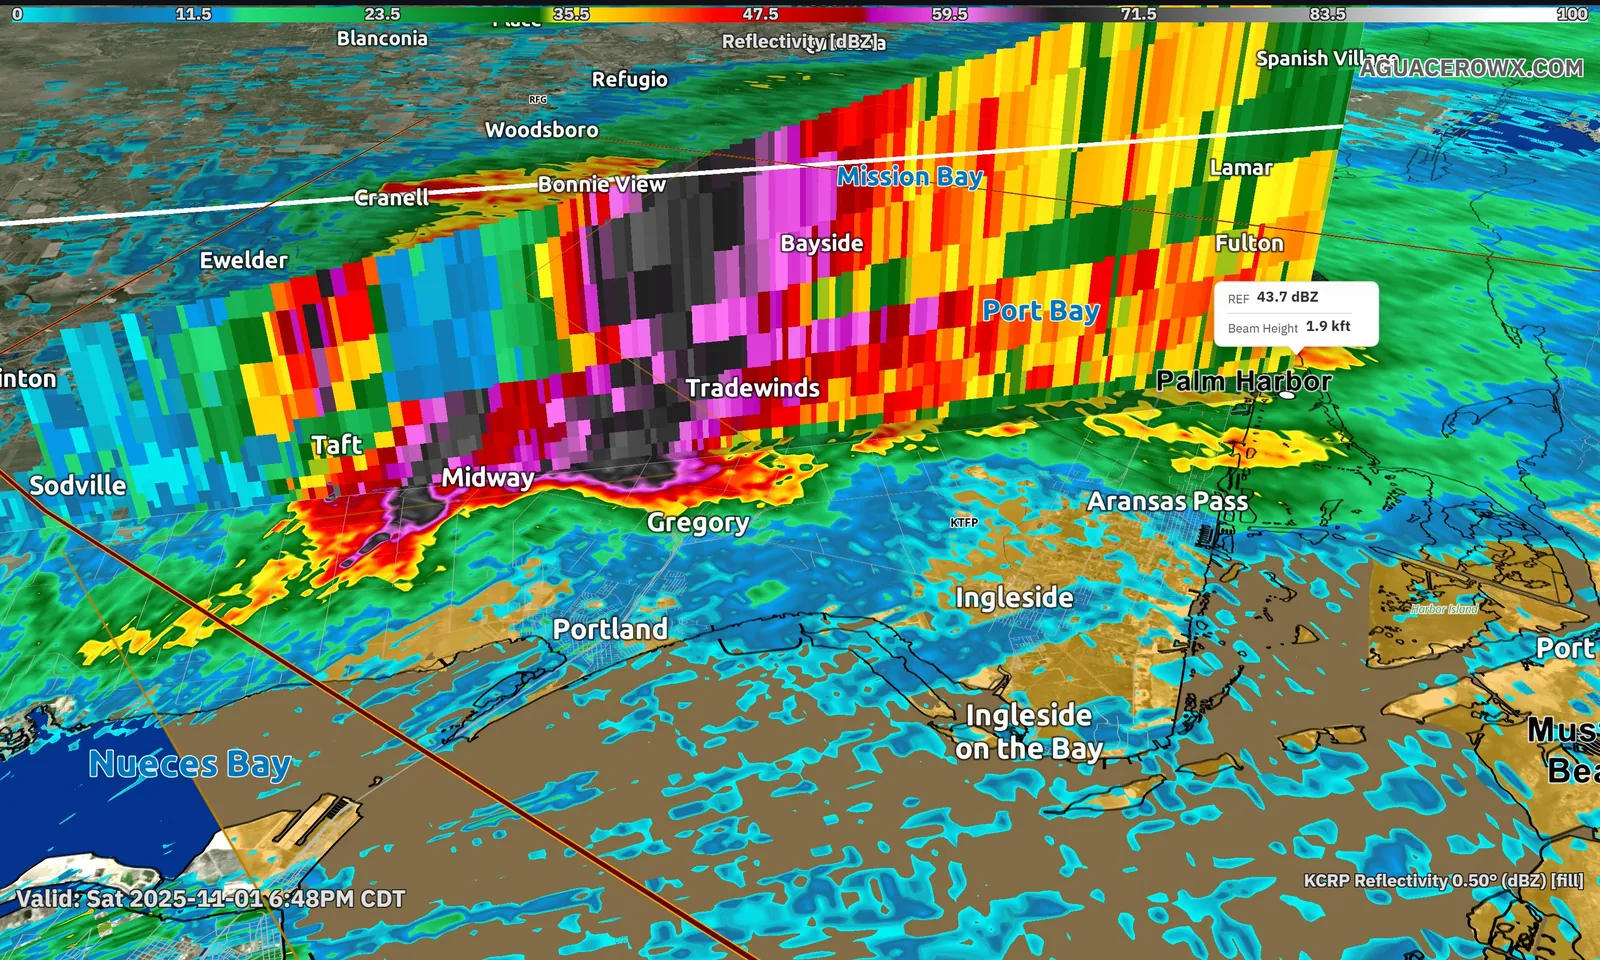
Slice through any cell for a vertical cross section that stands on the map, with smoothing.
ProfessionalHow to use
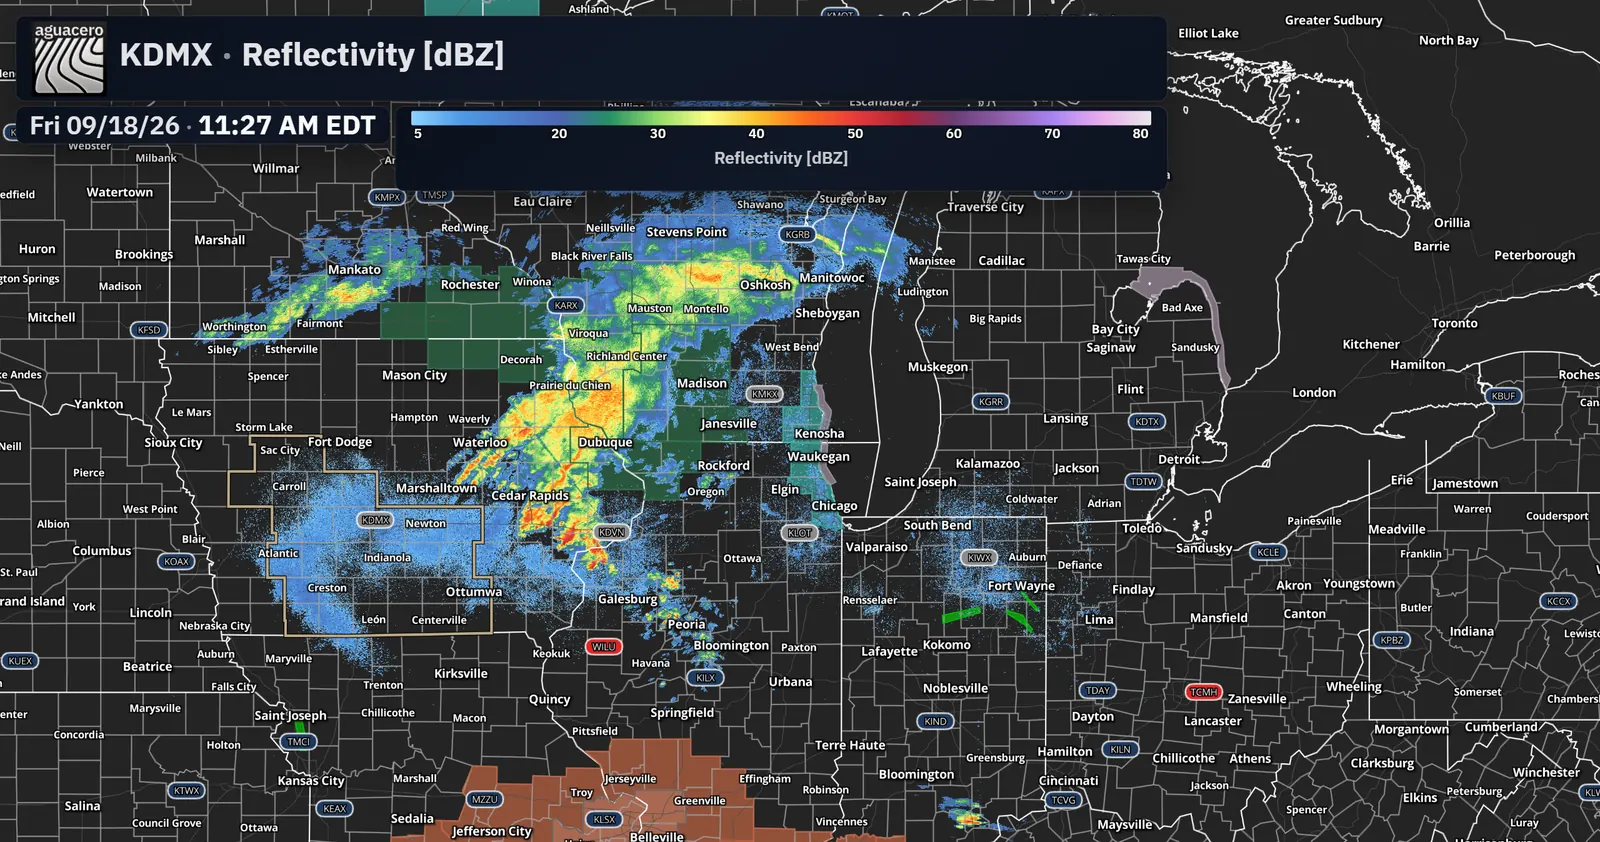
Up to 5 sites on one layer with the same product, tilt and colormap. The closest site wins where they overlap.
ProfessionalHow to use
Smooth transitions between radar and model frames as a loop plays.
ProfessionalHow to use
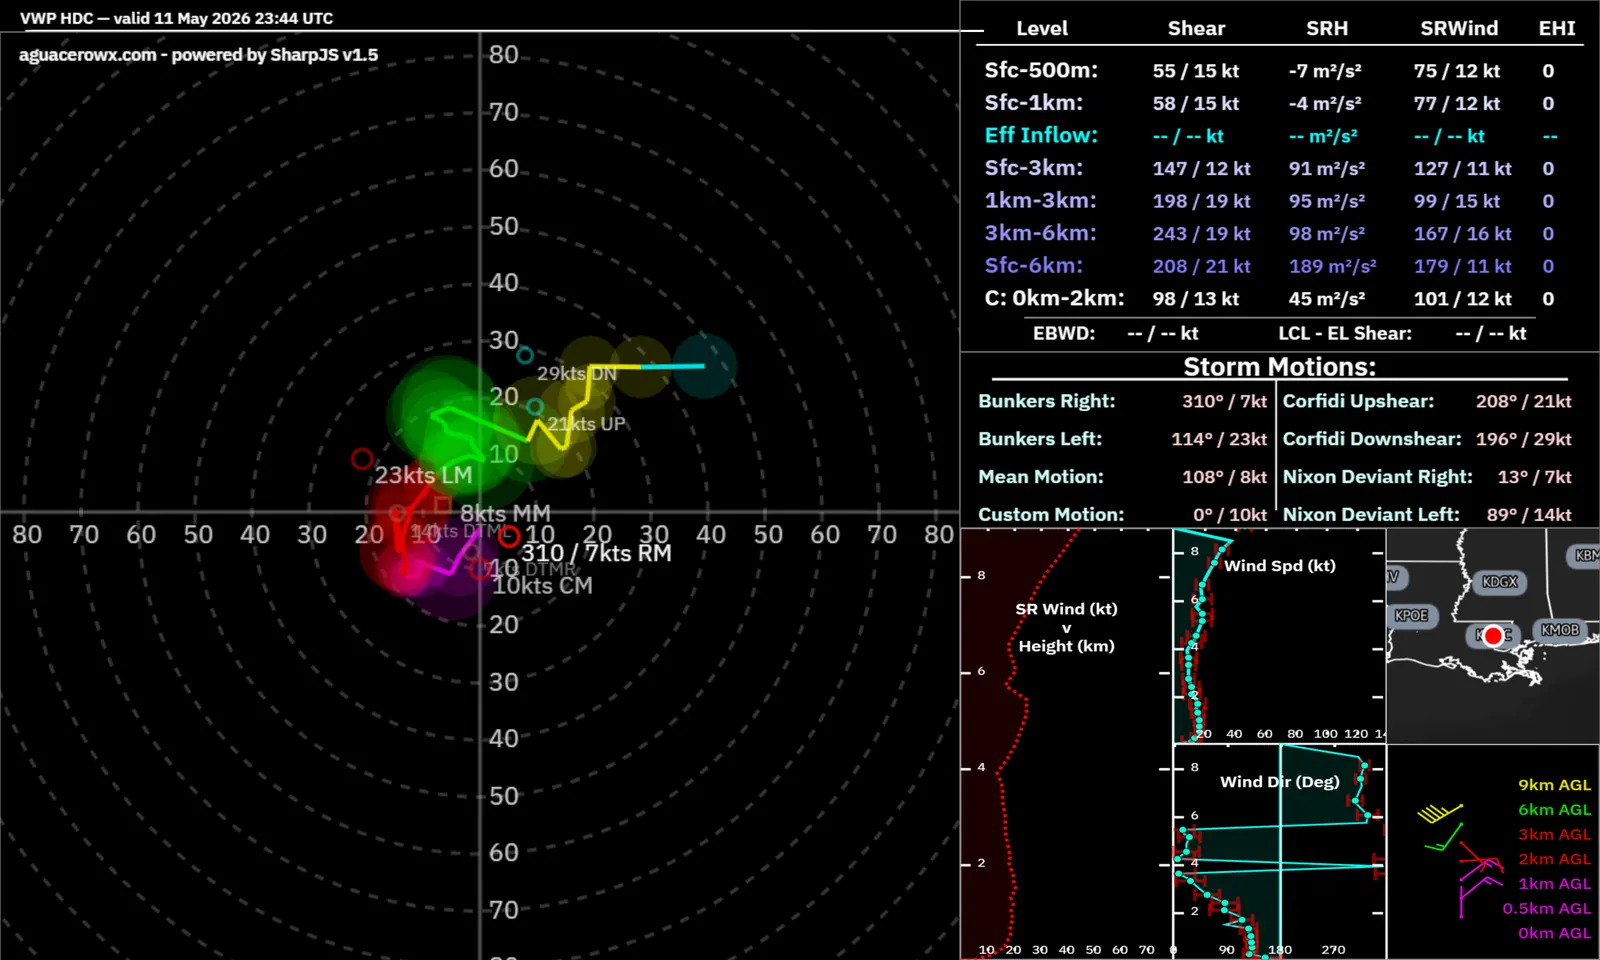
A VAD wind profile for any NEXRAD site as a hodograph with shear and storm motion, VWP barbs on the map, and a VWP time-height chart.
ToolbarHow to use
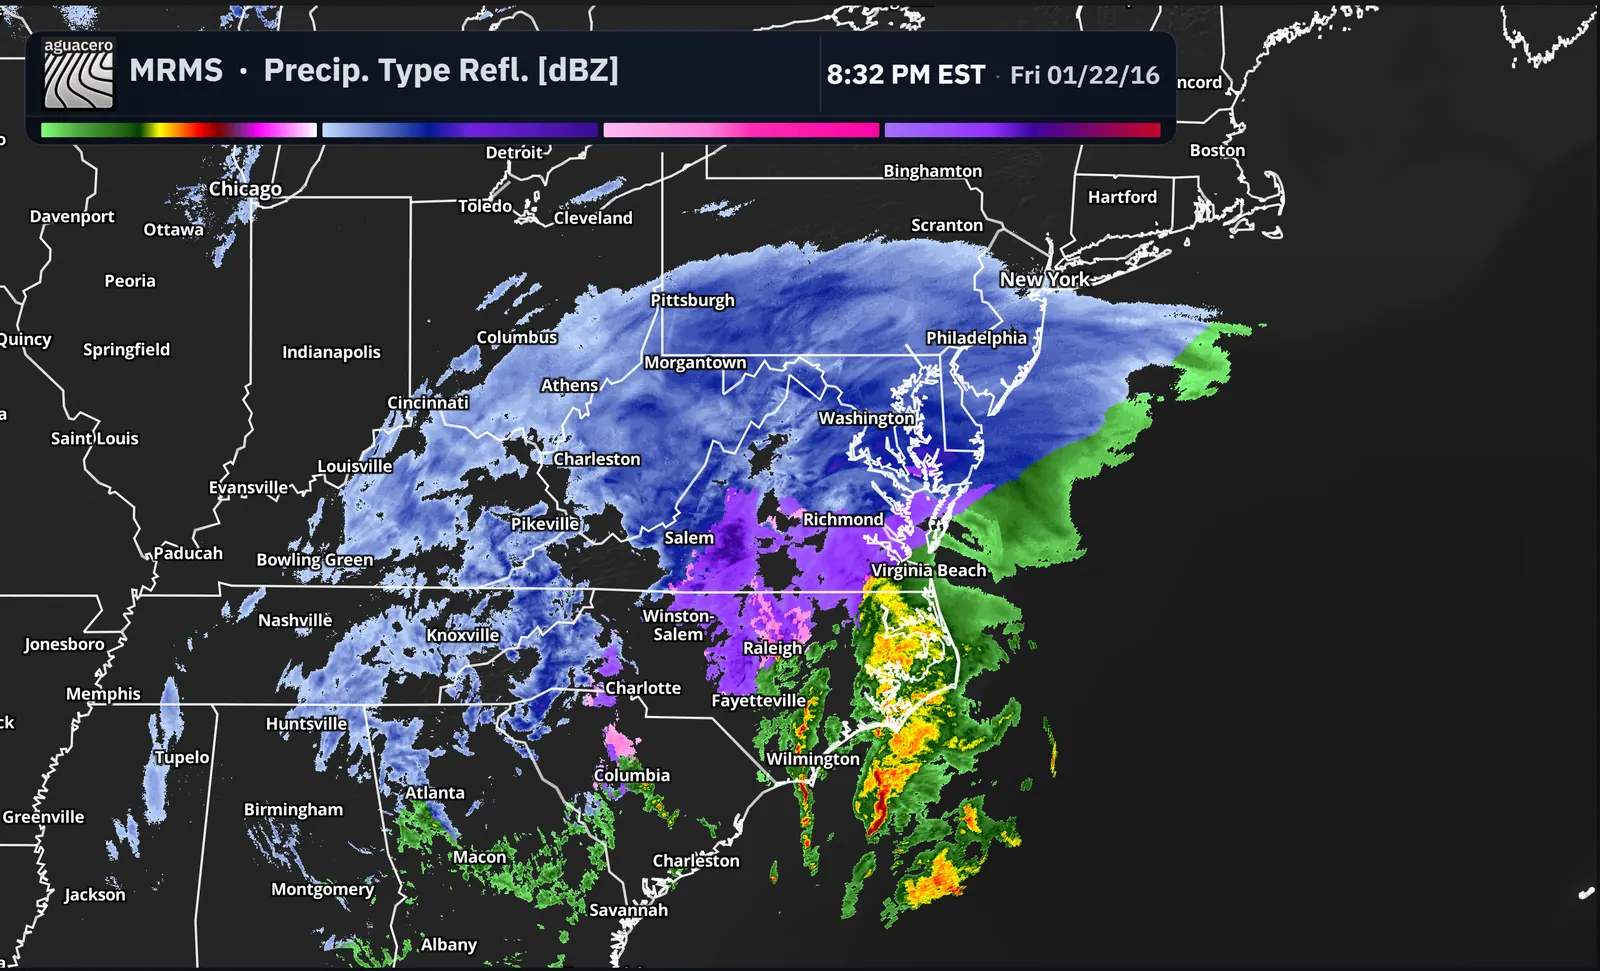
Precipitation-type reflectivity that separates rain, snow, sleet and freezing rain.
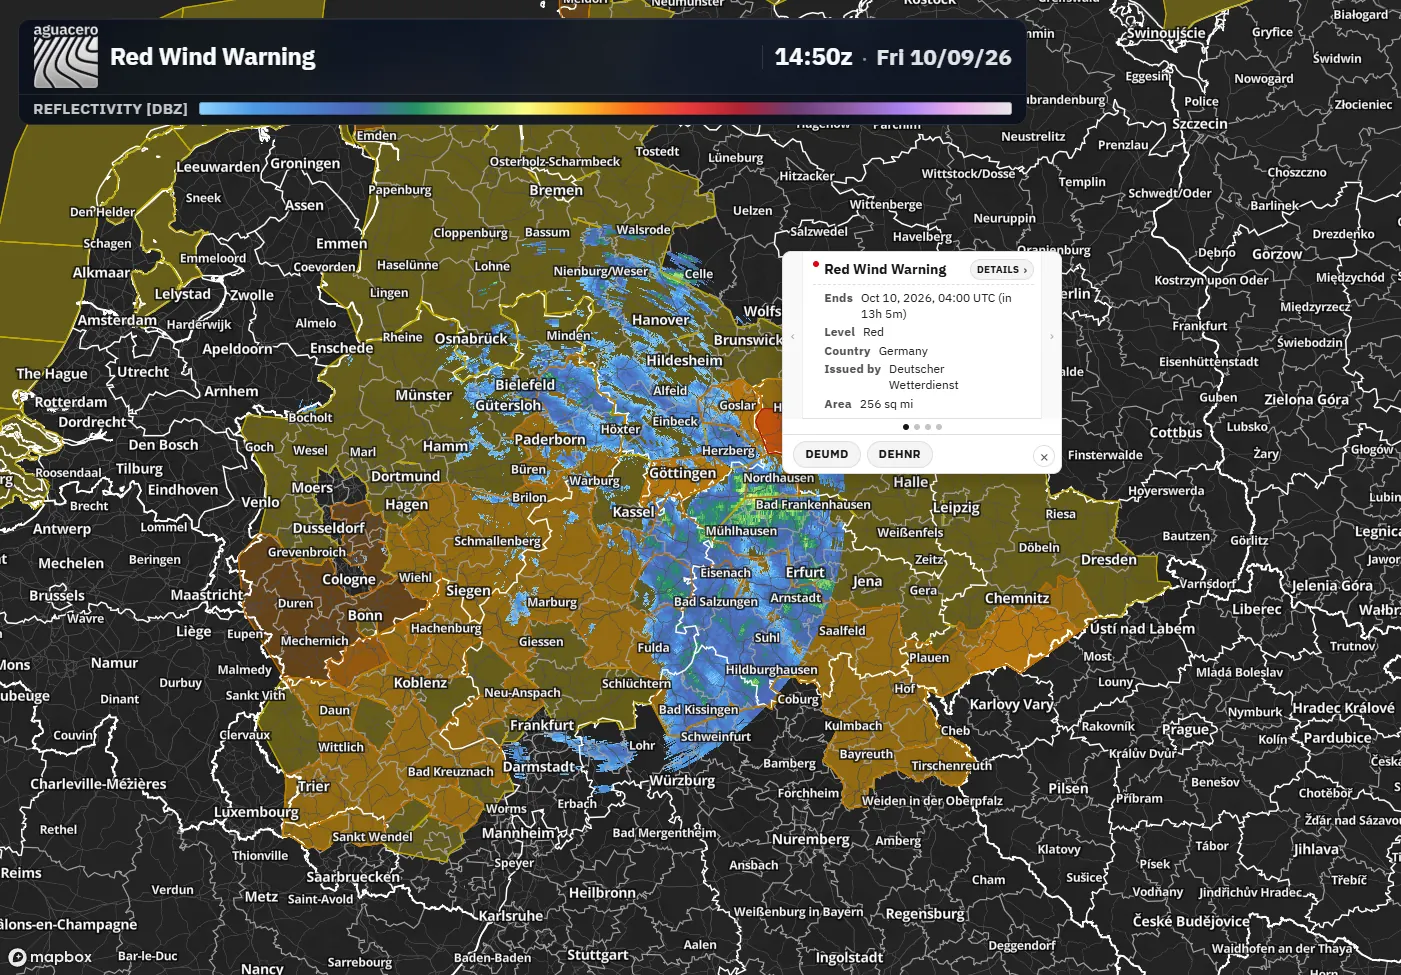
Multi-Radar Multi-Sensor reflectivity, rotation tracks, hail, QPE and 100+ more products, with switchable tilts and point readouts, on every plan.
Track a storm with its forecast path (or hold T and drag), pin tracks to NWS warnings, keep several on the map and see TVS detections.
ToolbarHow to use
9 features
GOES-East and West, Himawari-9 and EUMETSAT at native resolution, plus GLM lightning. Every band and RGB is on every plan; your plan sets how long loops run.
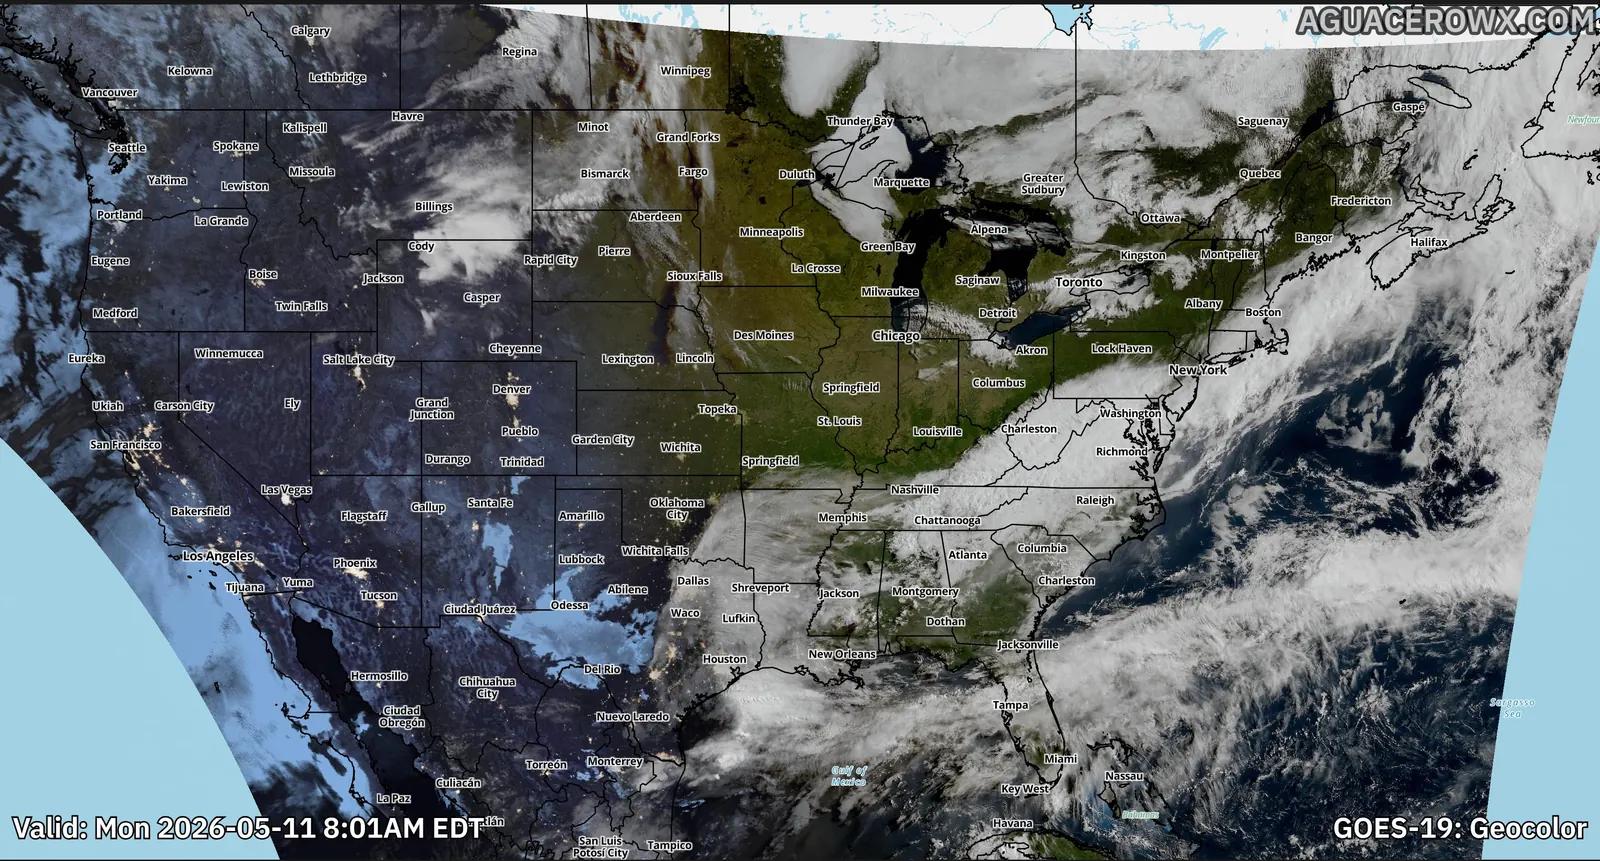
Every ABI band over CONUS, the full disk and the mesoscale sectors.
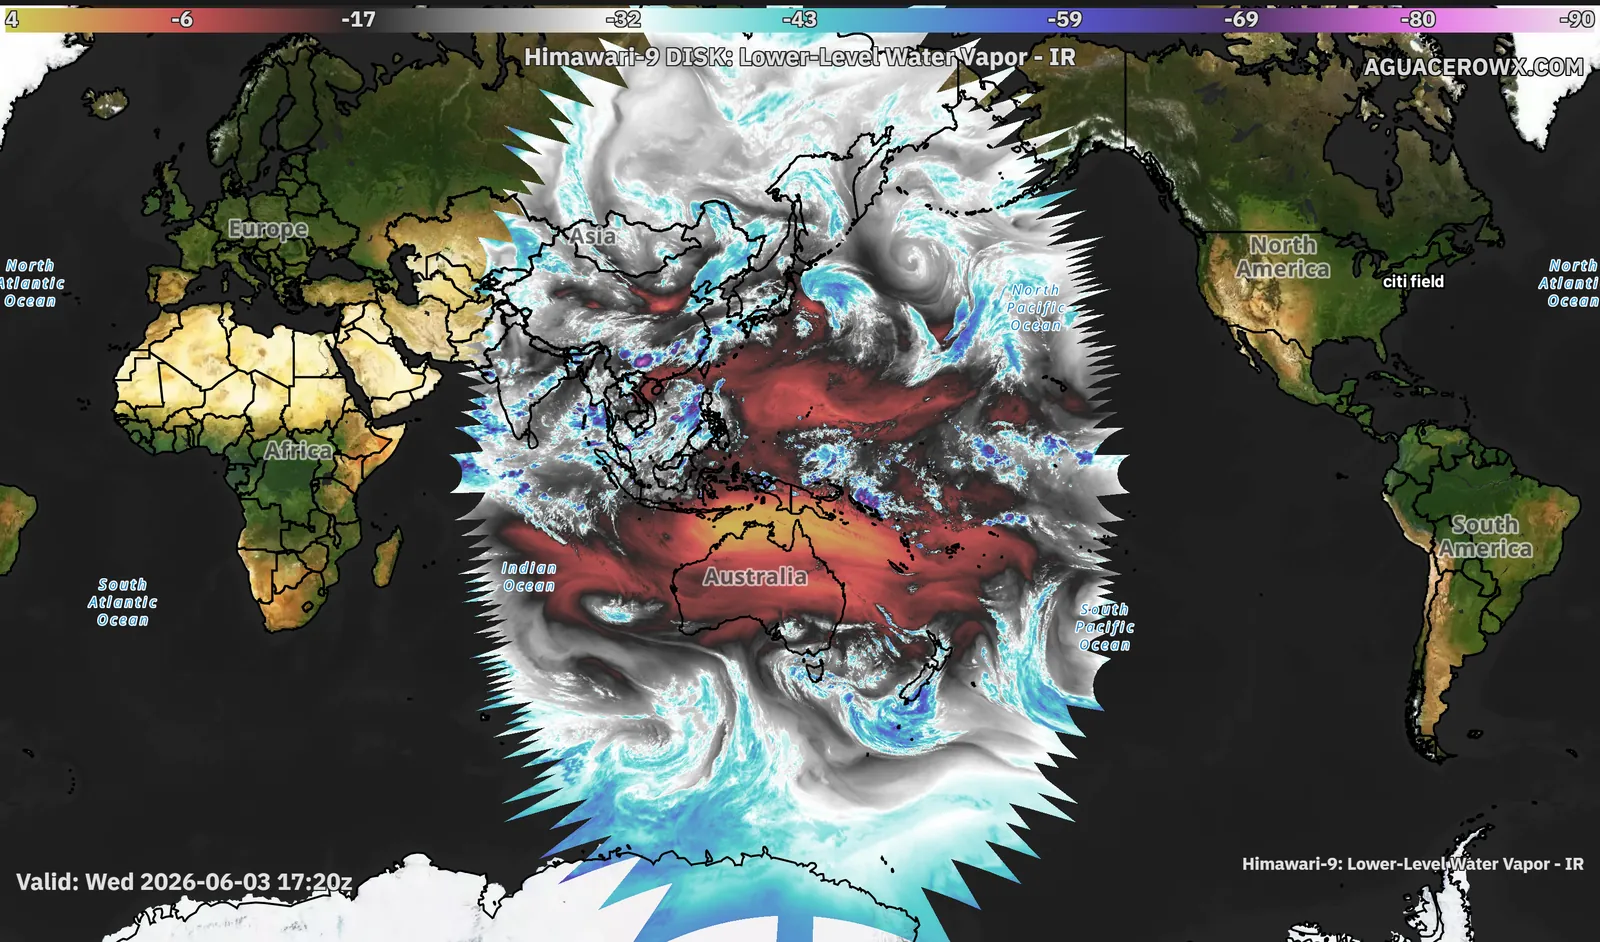
The western Pacific, Asia and Australia, with the same bands and products as GOES.
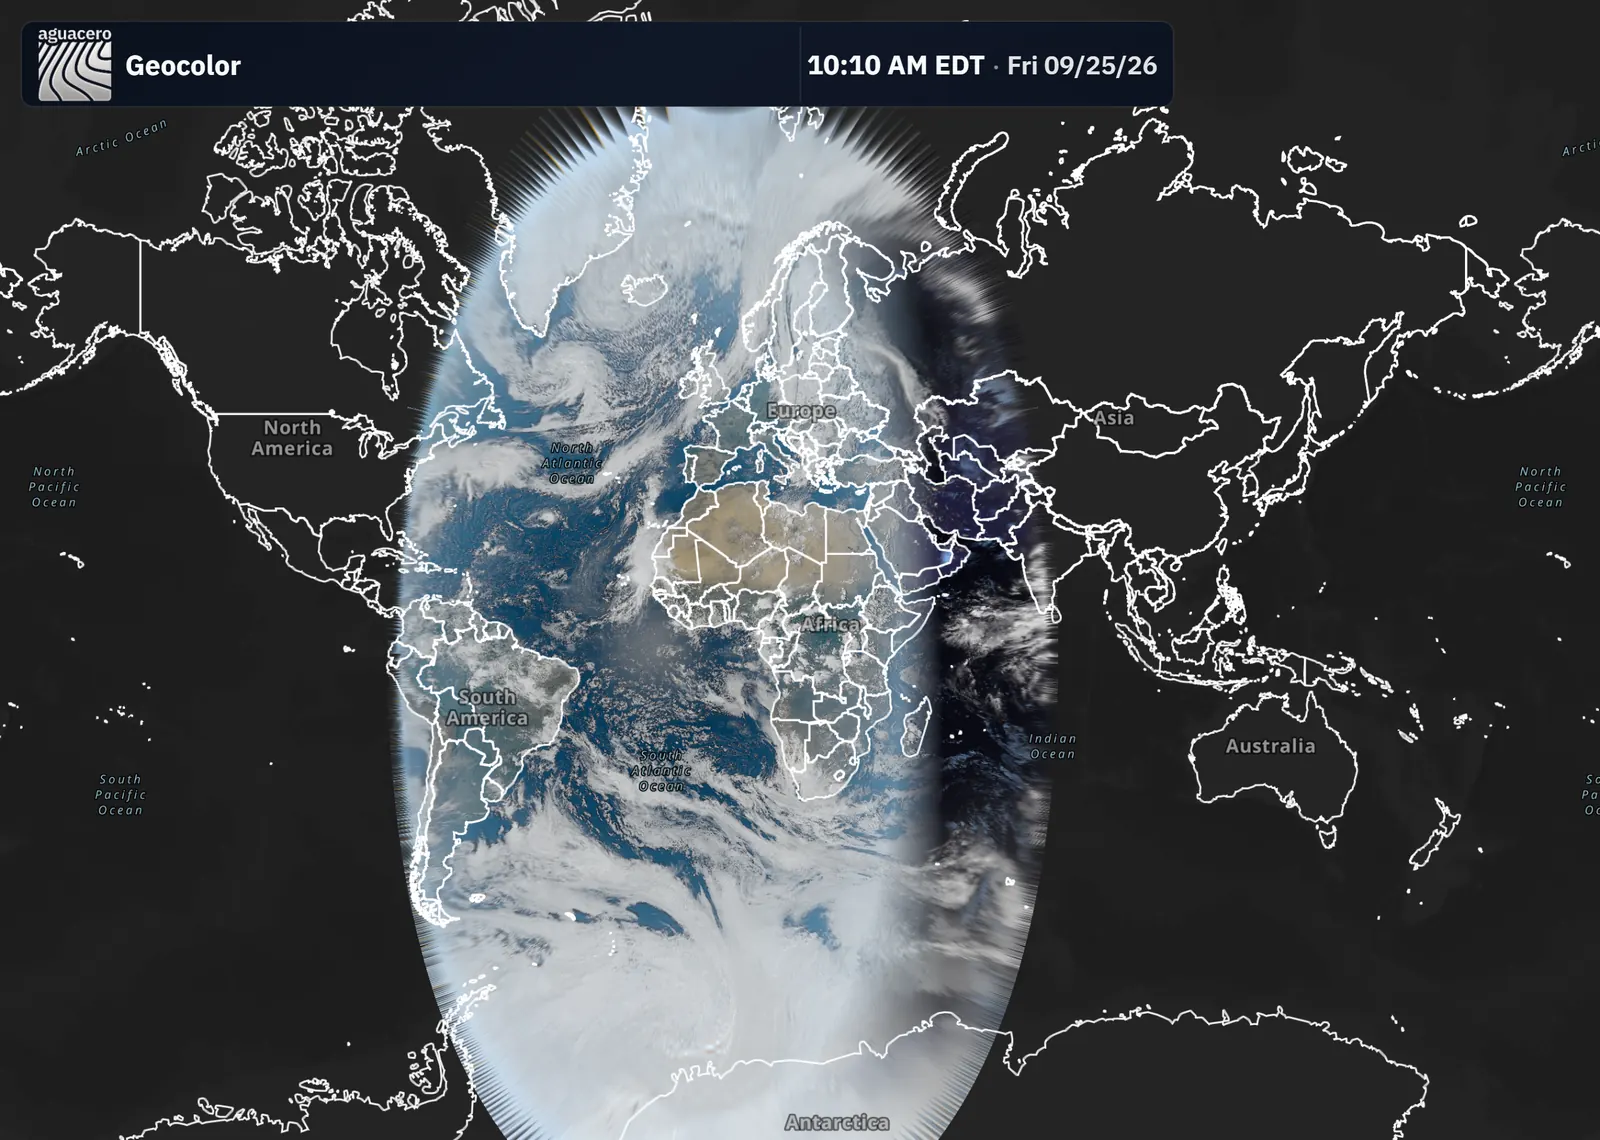
Meteosat over Europe and Africa, the Indian Ocean and Rapid Scan, with the products you know from GOES.
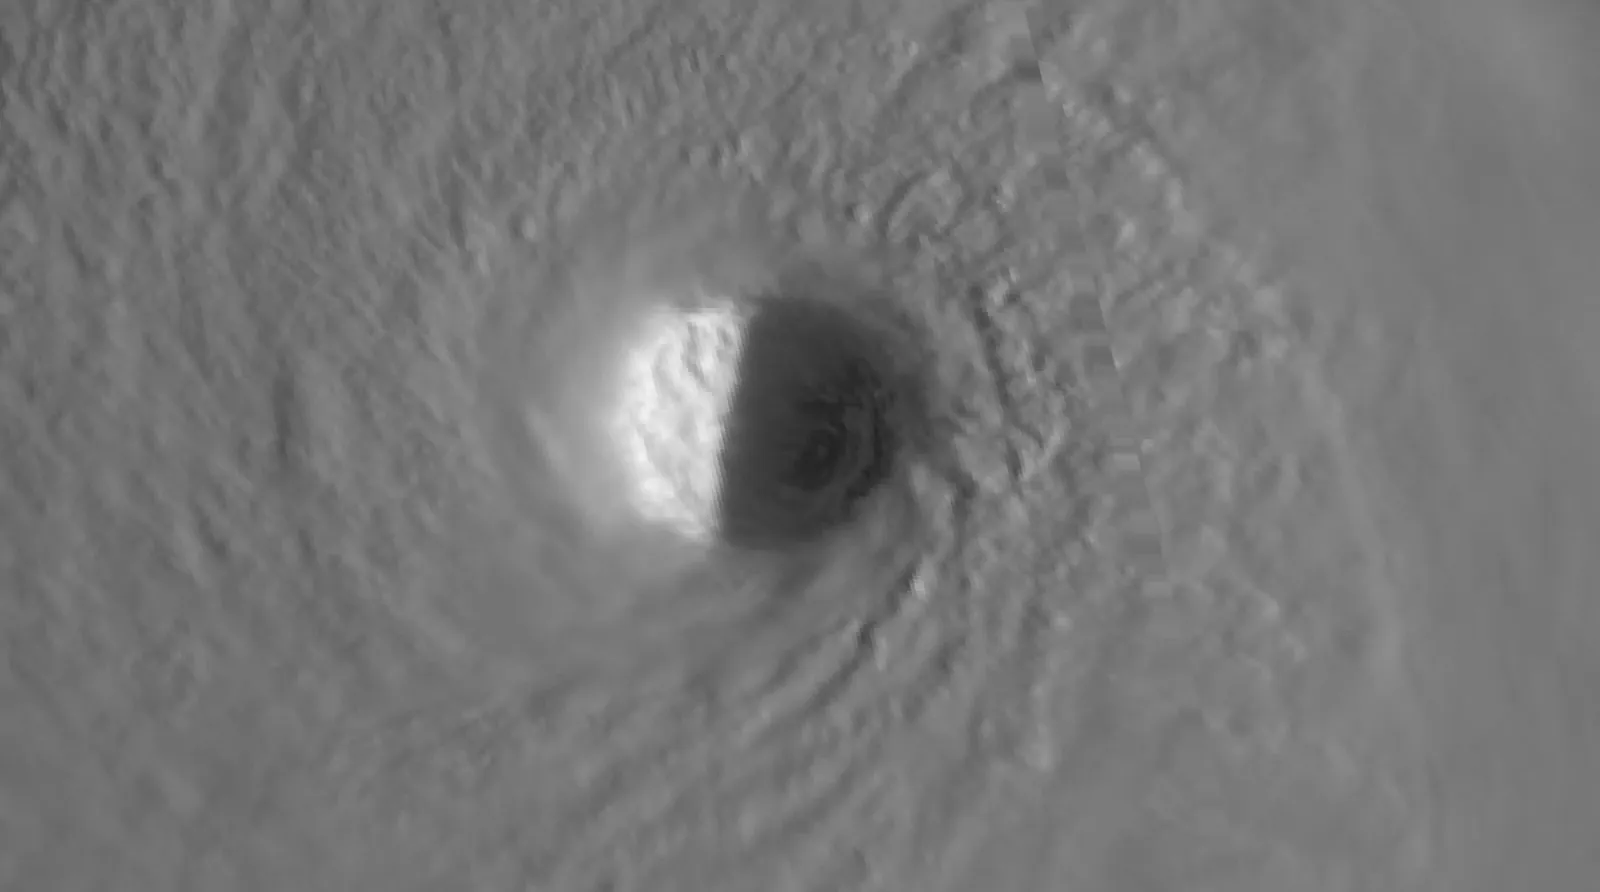
Imagery loads at native resolution as you zoom, down to 0.5 km for GOES visible.
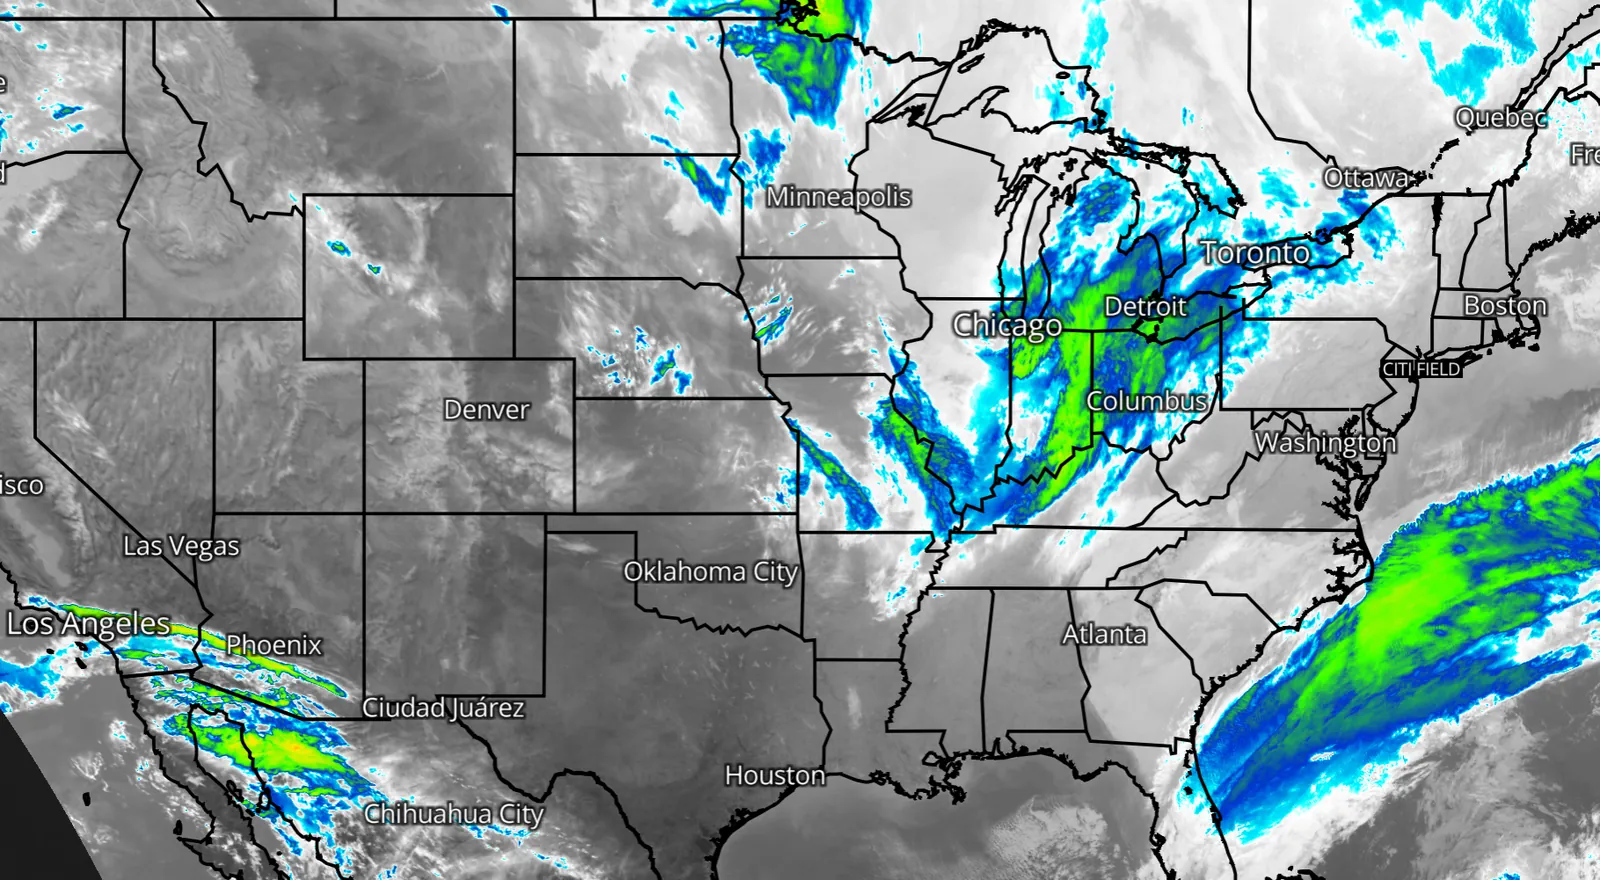
Restyle infrared and water vapor bands with your own colormaps.
GeoColor, Air Mass, Sandwich, Day Cloud Phase Distinction, Day Convection, Nighttime Microphysics, Dust, Fire Temperature, Day Snow-Fog and more.
Build your own composite from the bands, with day and night stacks, stretch and RGB mix, then load it on the map.
ProfessionalHow to use
GLM lightning over the past 24 hours, filtered by time, intensity and energy, with an optional strike counter.
ToolbarHow to use
13 features
Click, drag or draw on the map for a vertical look at the atmosphere, or follow one point through time.
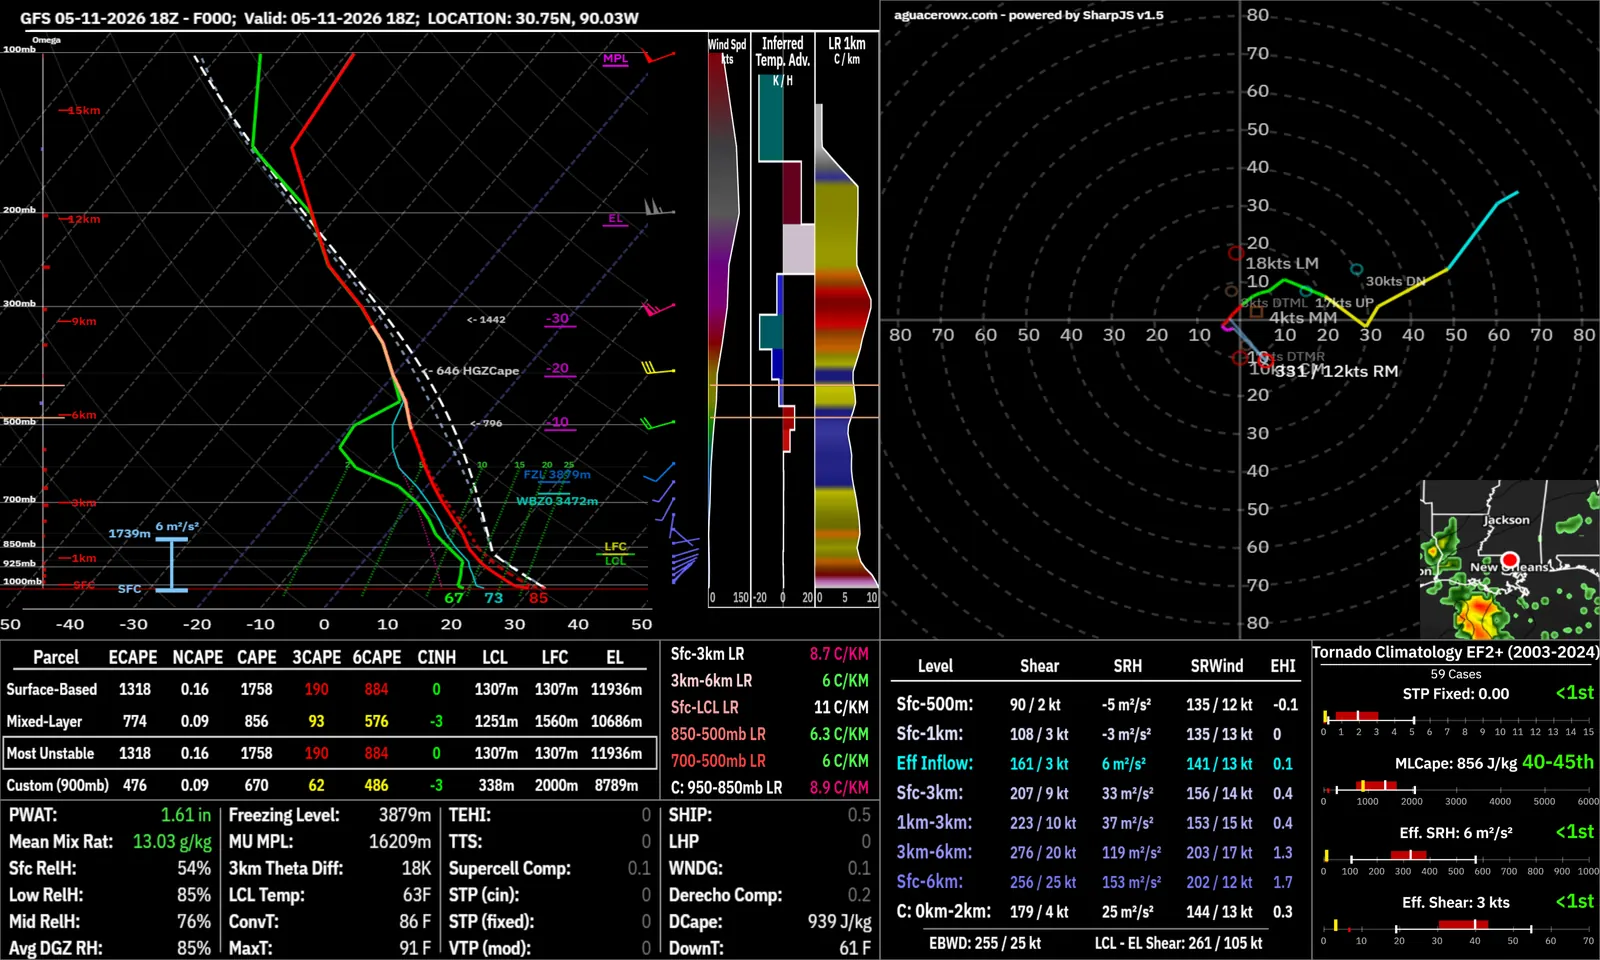
Right-click anywhere for a Skew-T with hodograph, parcels, ECAPE and severe and winter parameters, from any model or the SPC Mesoanalysis.
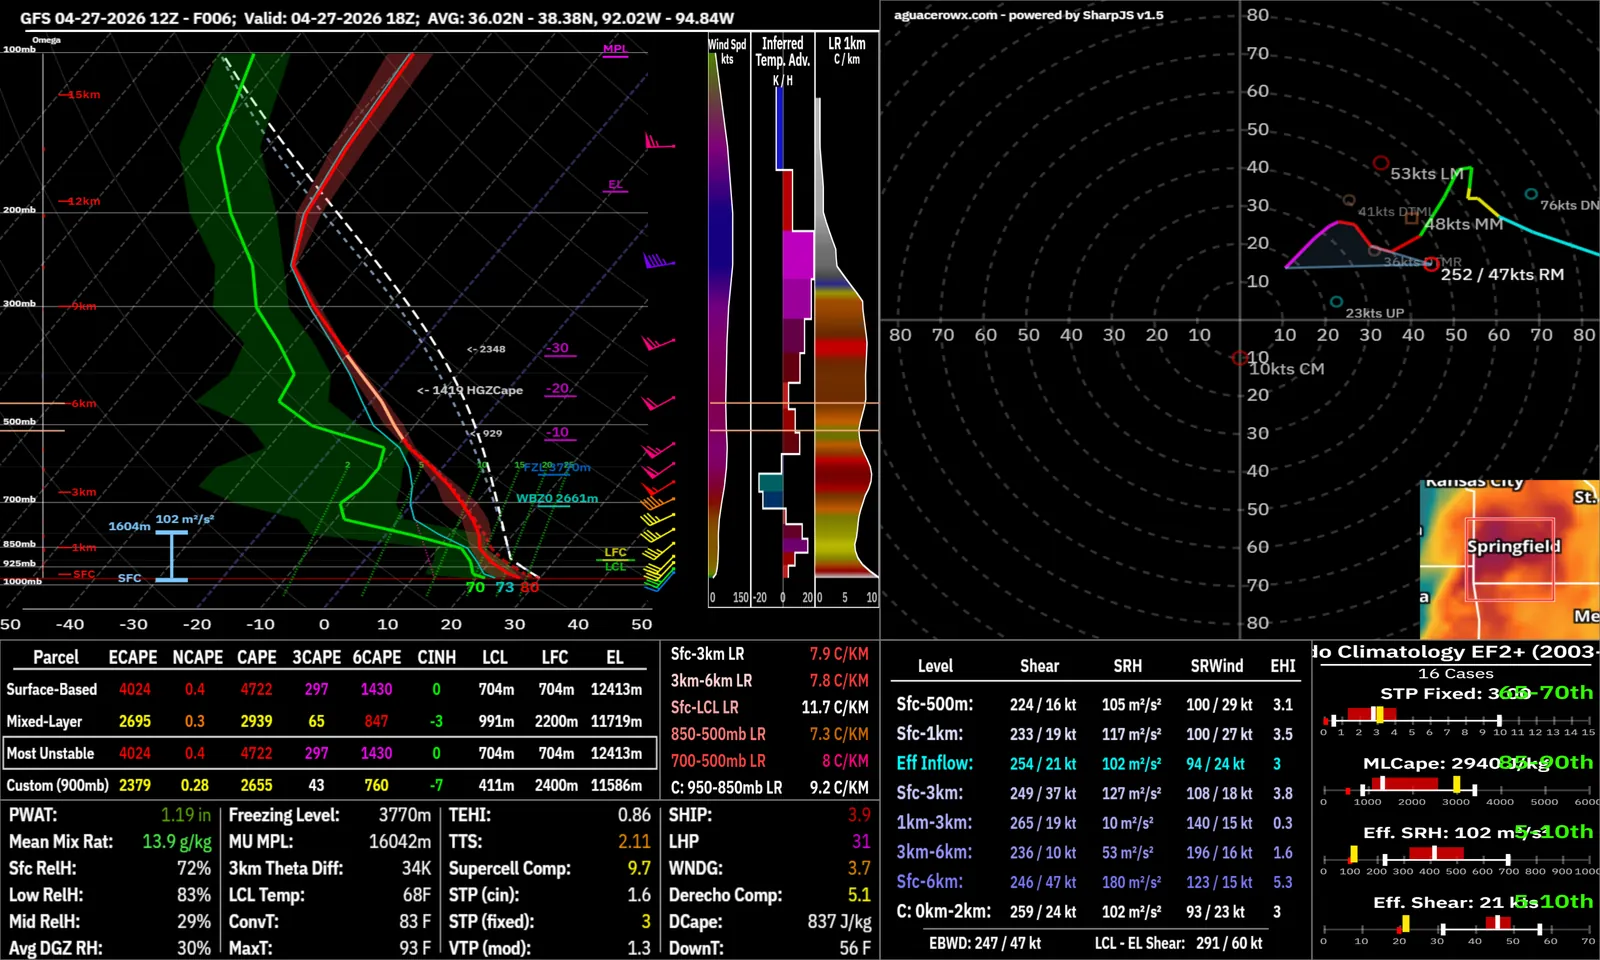
Draw a box with the toolbar, or hold B and drag, for a sounding averaged over the area.
ToolbarHow to use
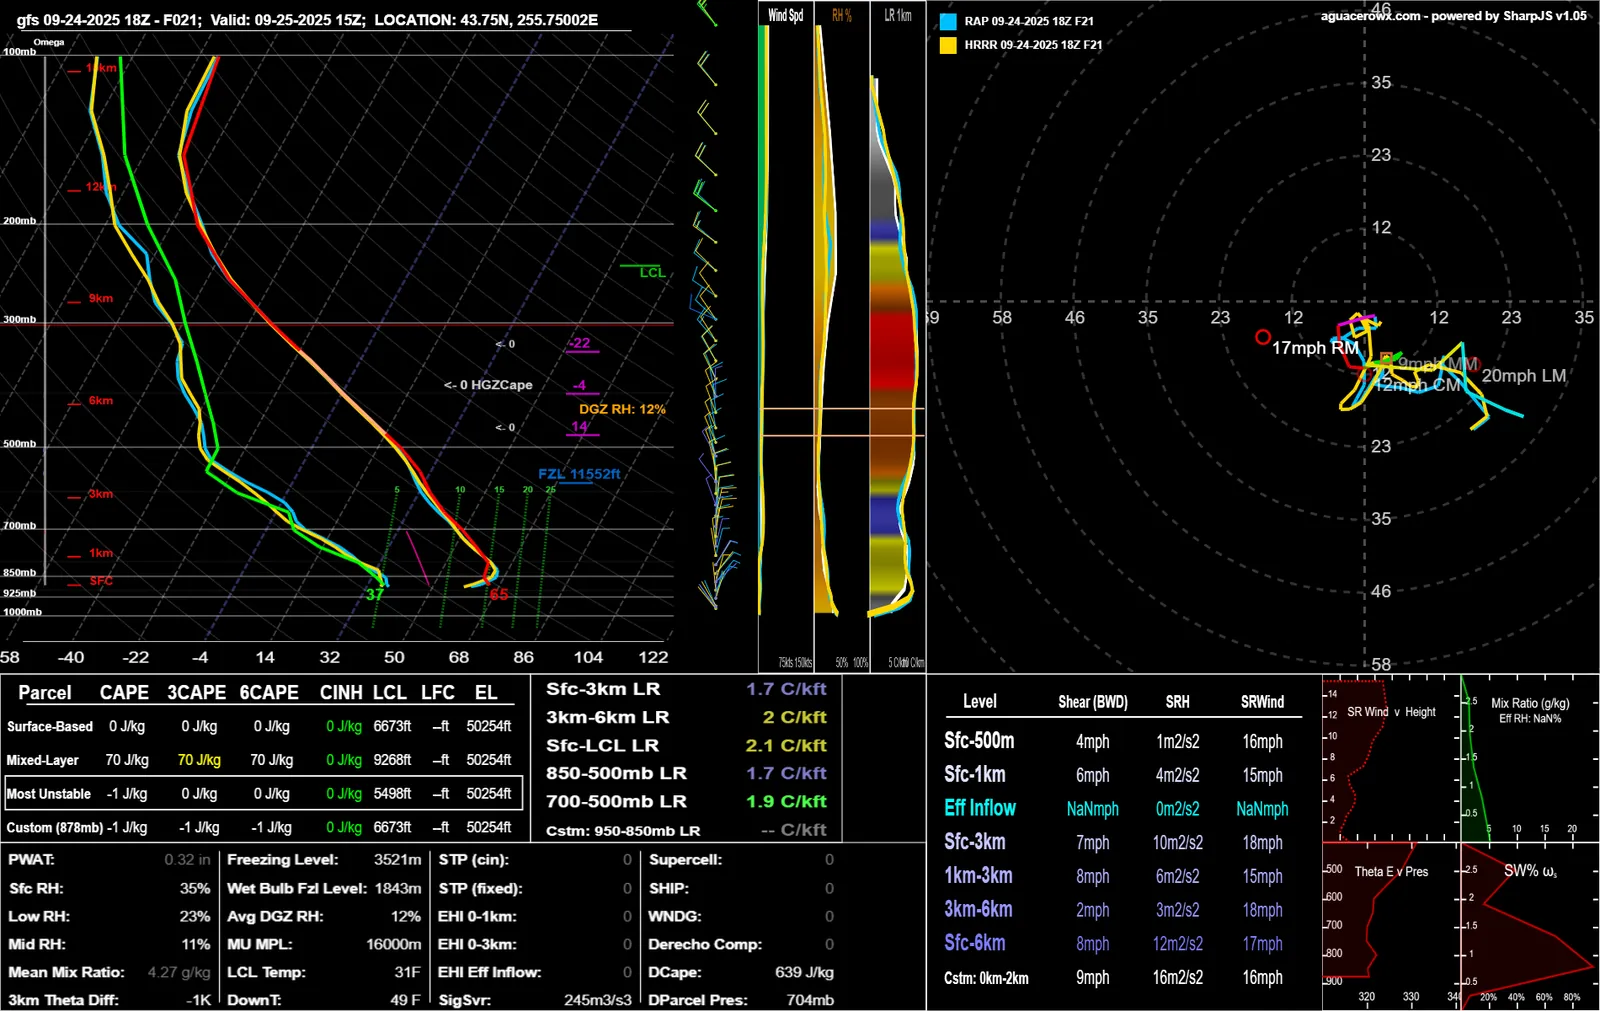
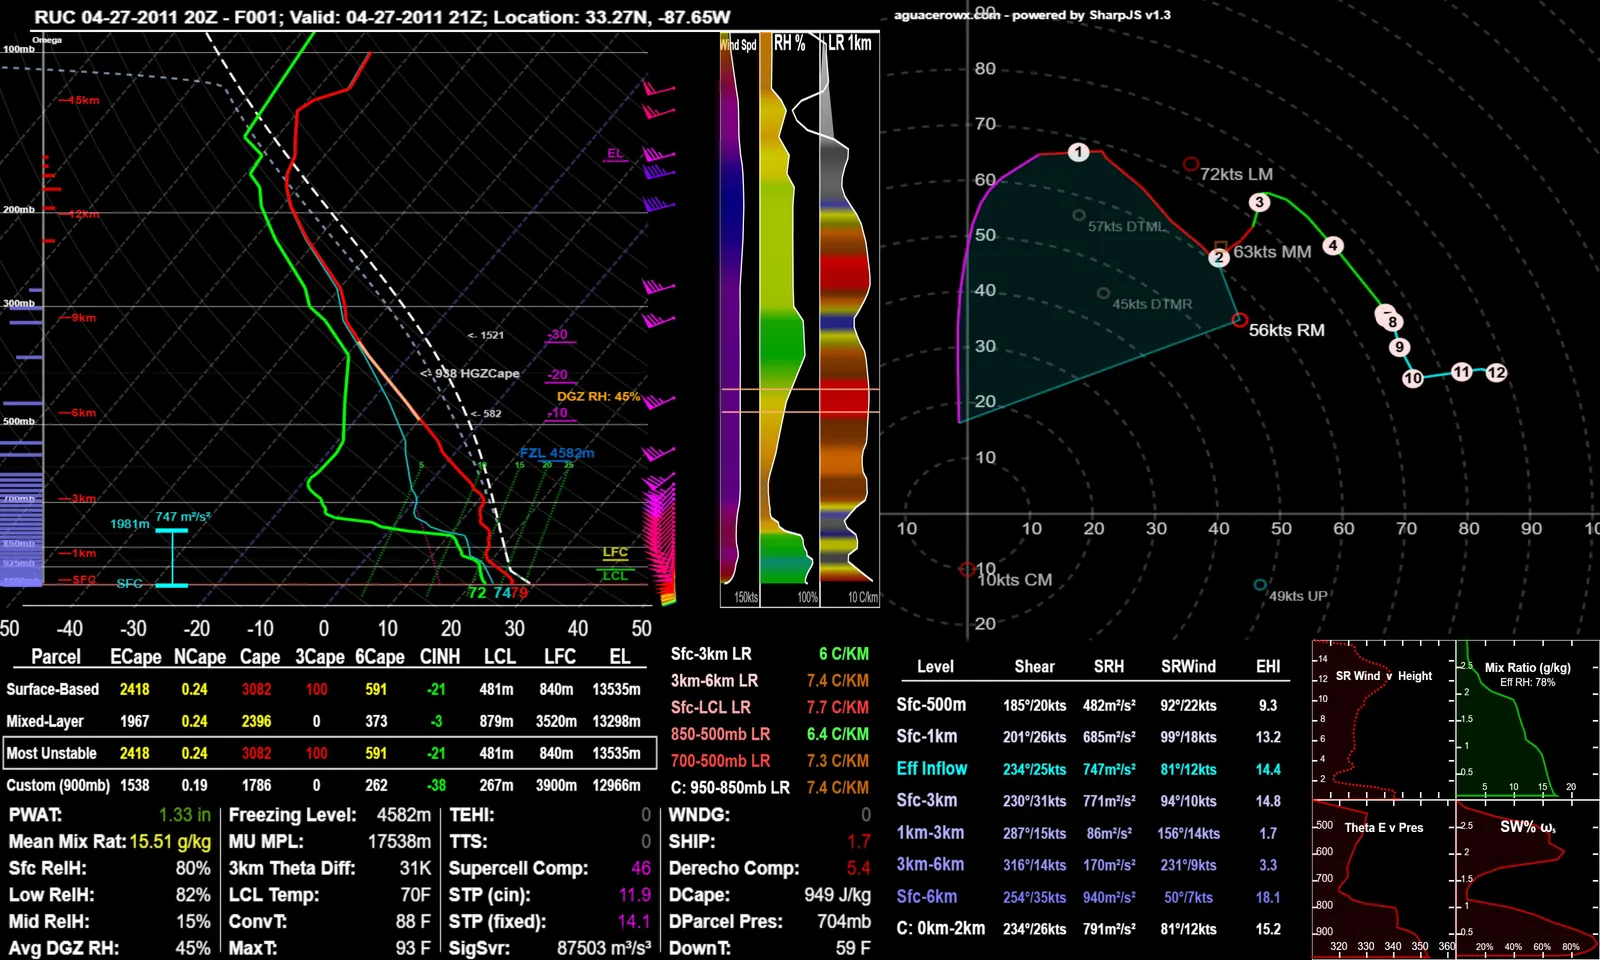
Load archived RAOB and, for select models, BUFKIT soundings for past events.
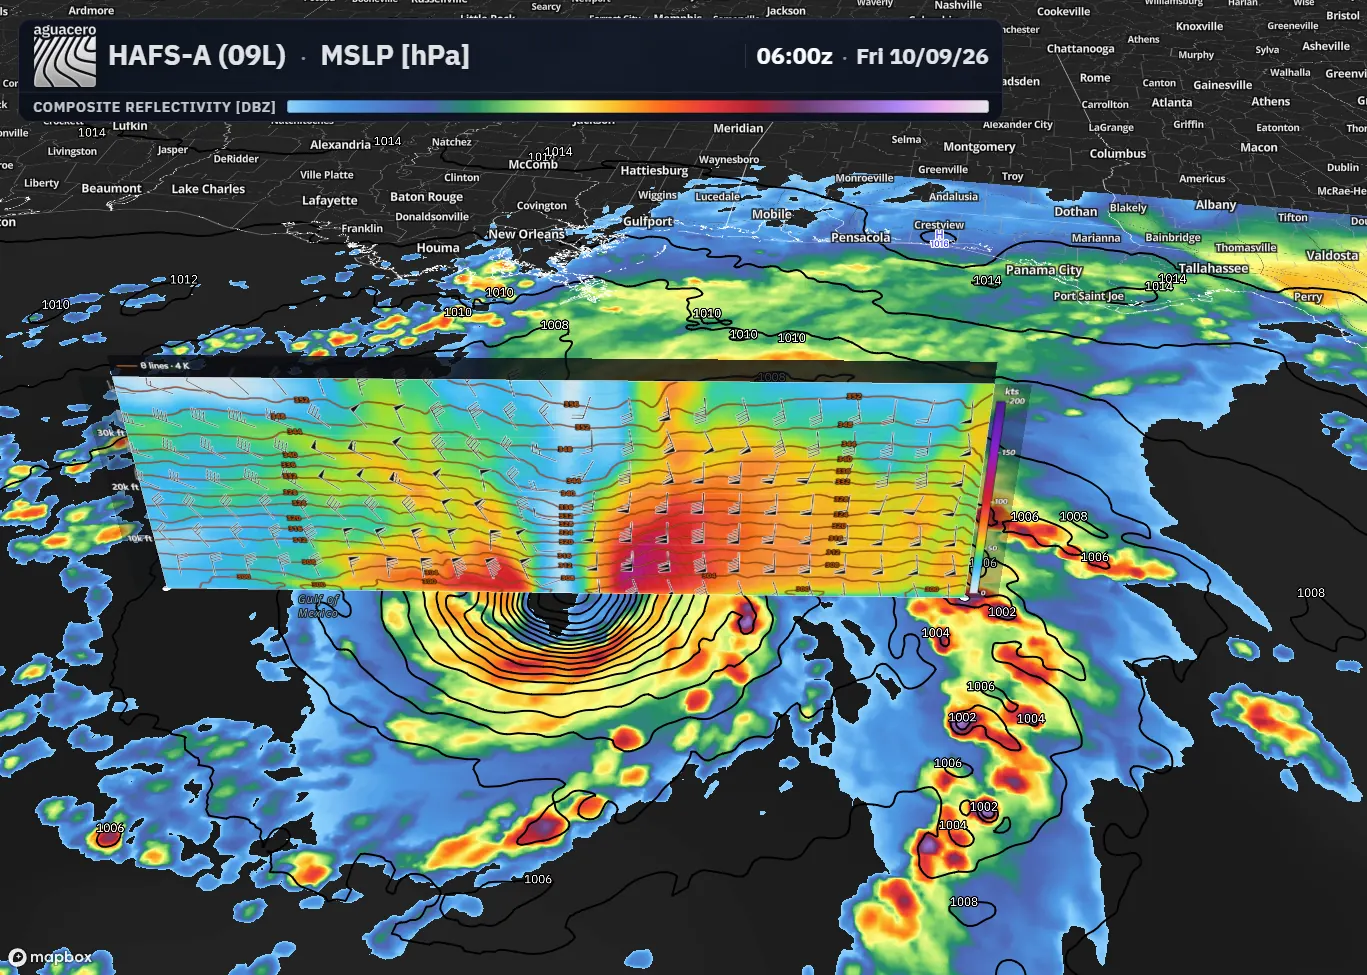
Draw a line (or Ctrl + drag) for a cross section with presets and overlays. It stands on the map as a curtain, and can subtract one model from another.
ToolbarHow to use
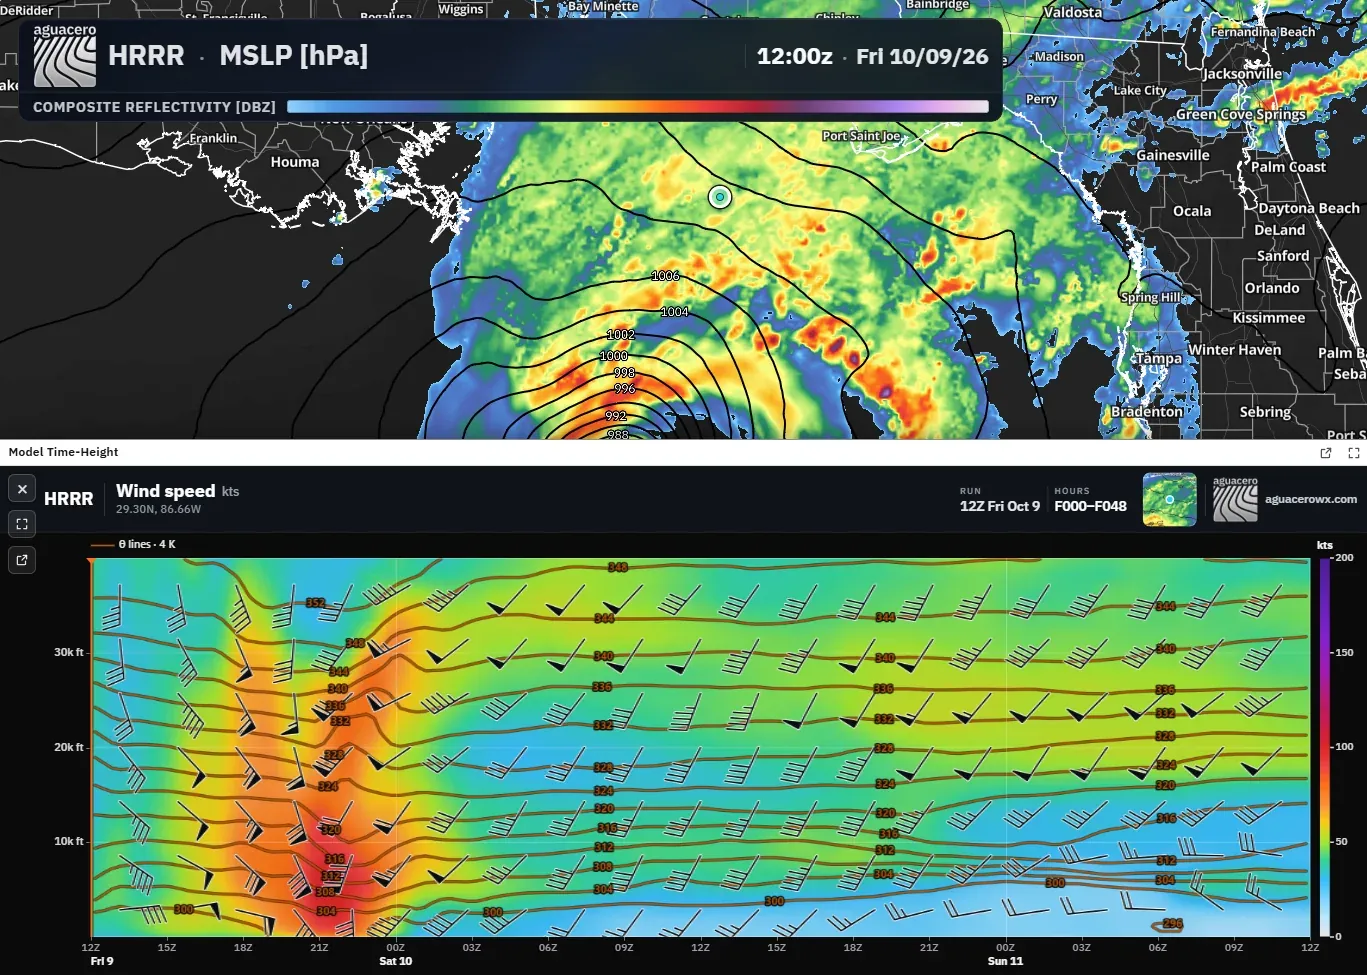
Right-click for a model run at one point over time, with the same fills, barbs and contours as cross sections.
New in 6.10How to use
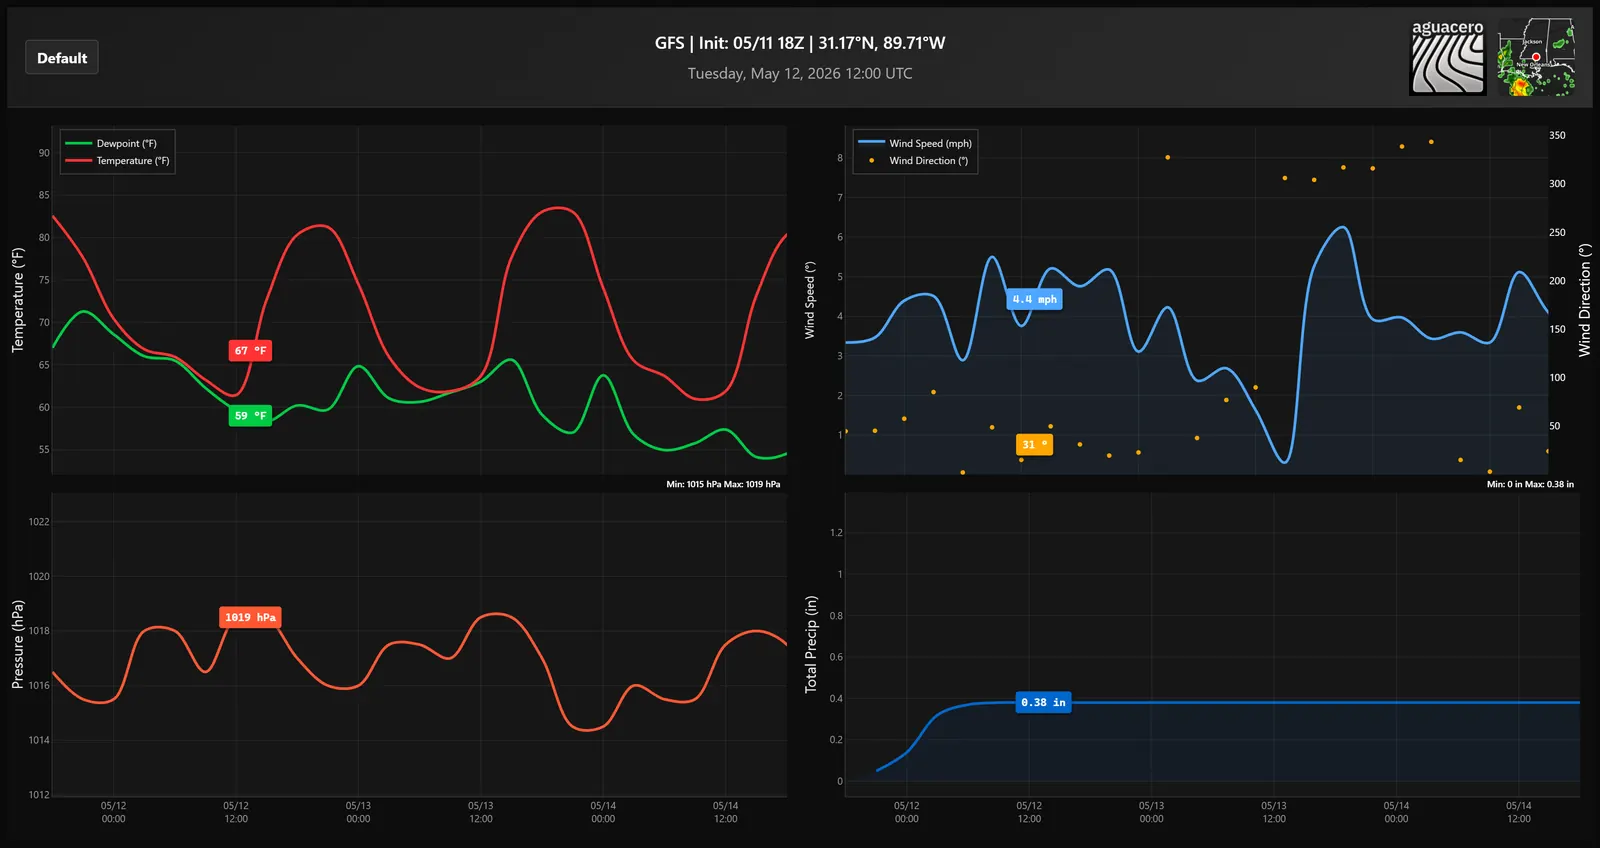
Temperature, dew point, wind, pressure and precipitation through the run, with multi-model plumes, means and box plots on Professional.
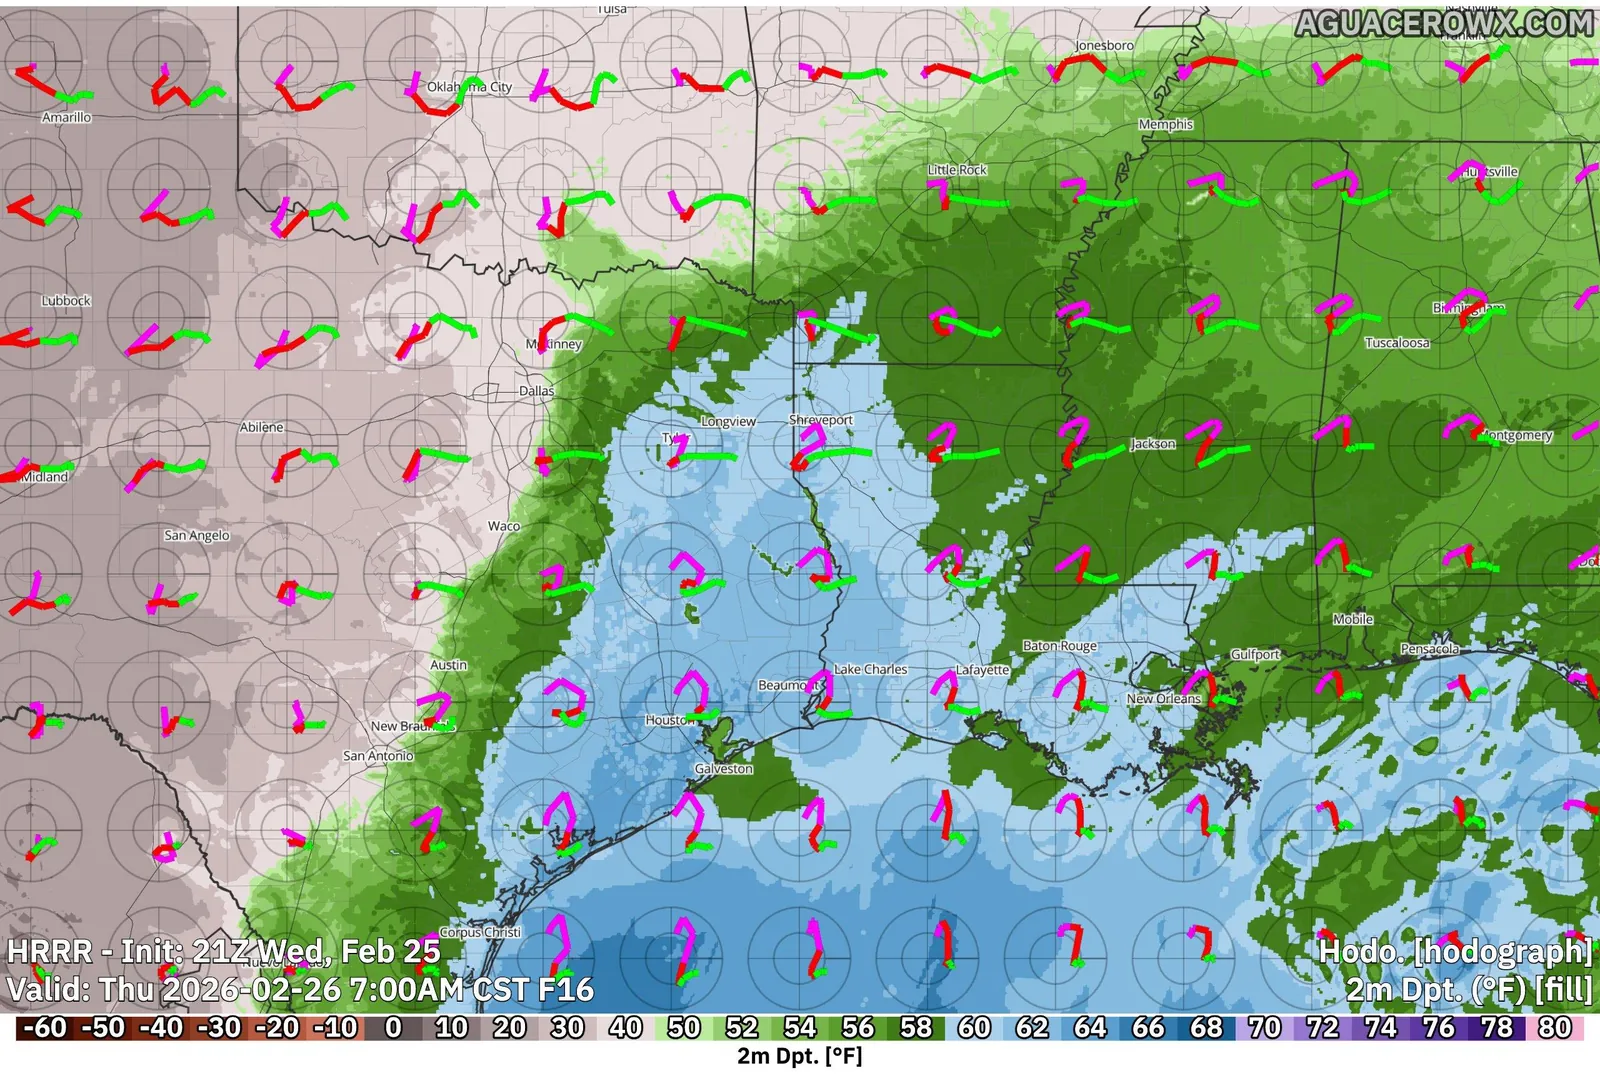
Global radiosonde launches on the map. Click a station for its observed sounding.
ToolbarHow to use
A model sounding that follows your cursor, or that you drag across the map. The profile updates as it moves.
New in 6.10How to use
Temperature to 500 m, its anomaly, 7-, 15- and 30-day change and the 20 °C isotherm along any line.
New in 6.10How to use
Soundings, meteograms, cross sections and VWP plots open full screen, docked under the map or in a window you can move and resize.
New in 6.10How to use
8 features
Surface stations, storm reports, river gauges and precipitation analyses on the same map as everything else.
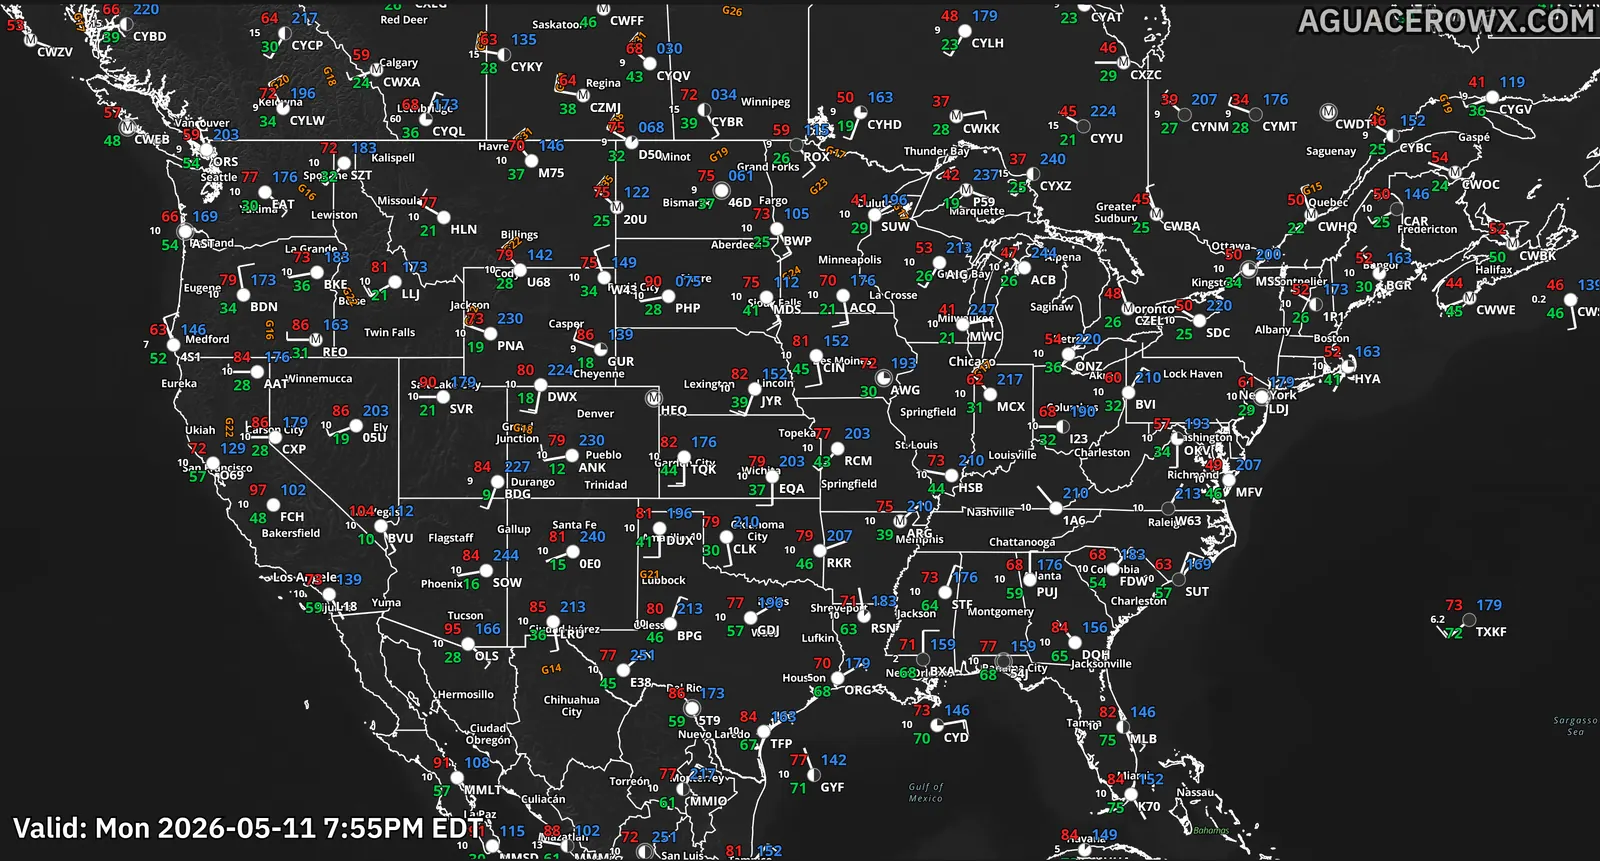
Surface station plots with raw METARs, wet bulb and RH, RAWS stations and your own colormaps.
ToolbarHow to use
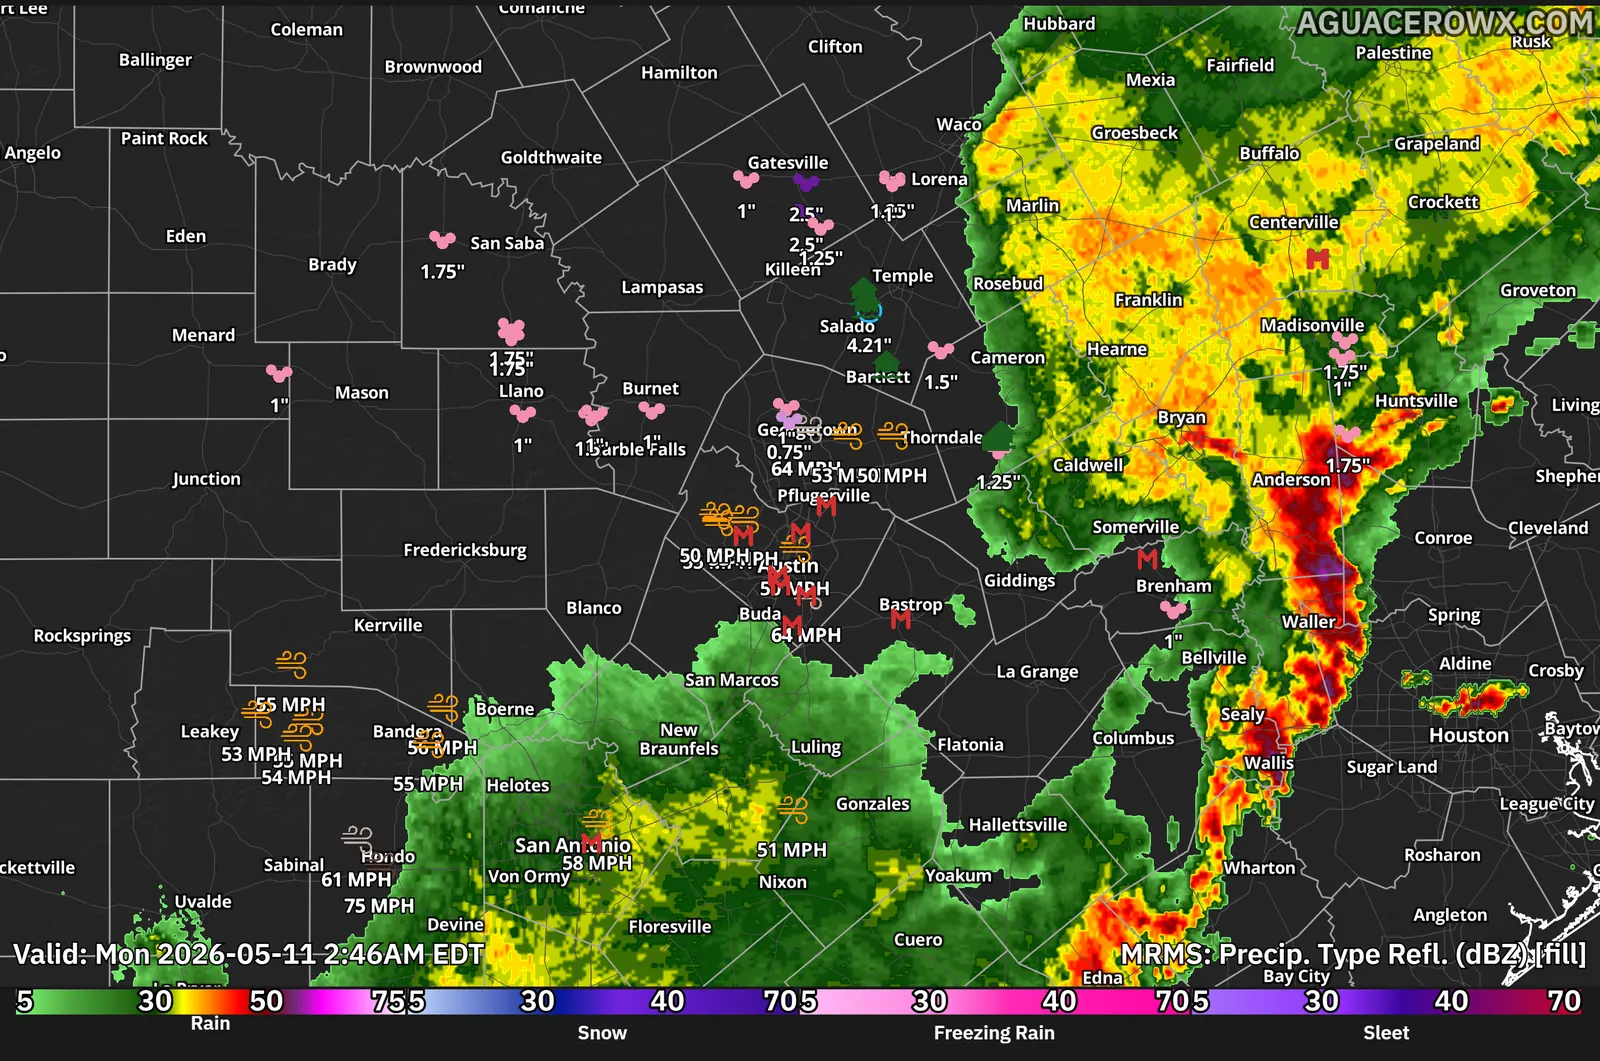
Hail, wind, tornado, flood and snow reports, plus CoCoRaHS gauges, clustered by zoom.
ToolbarHow to use
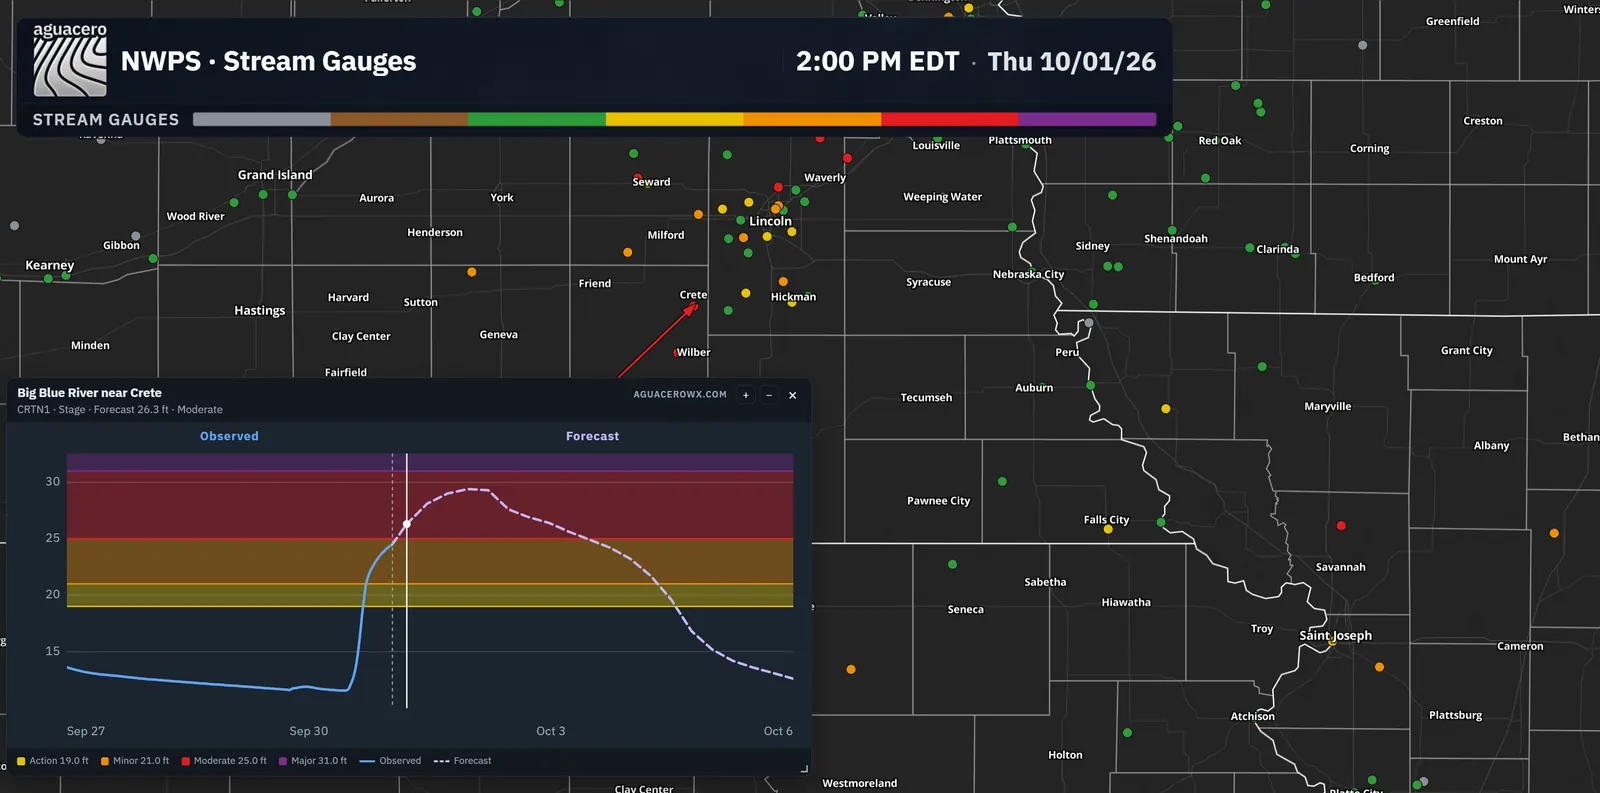
NWPS gauges by flood category. Click one for the observed and forecast hydrograph.
New in 6.9ToolbarHow to use
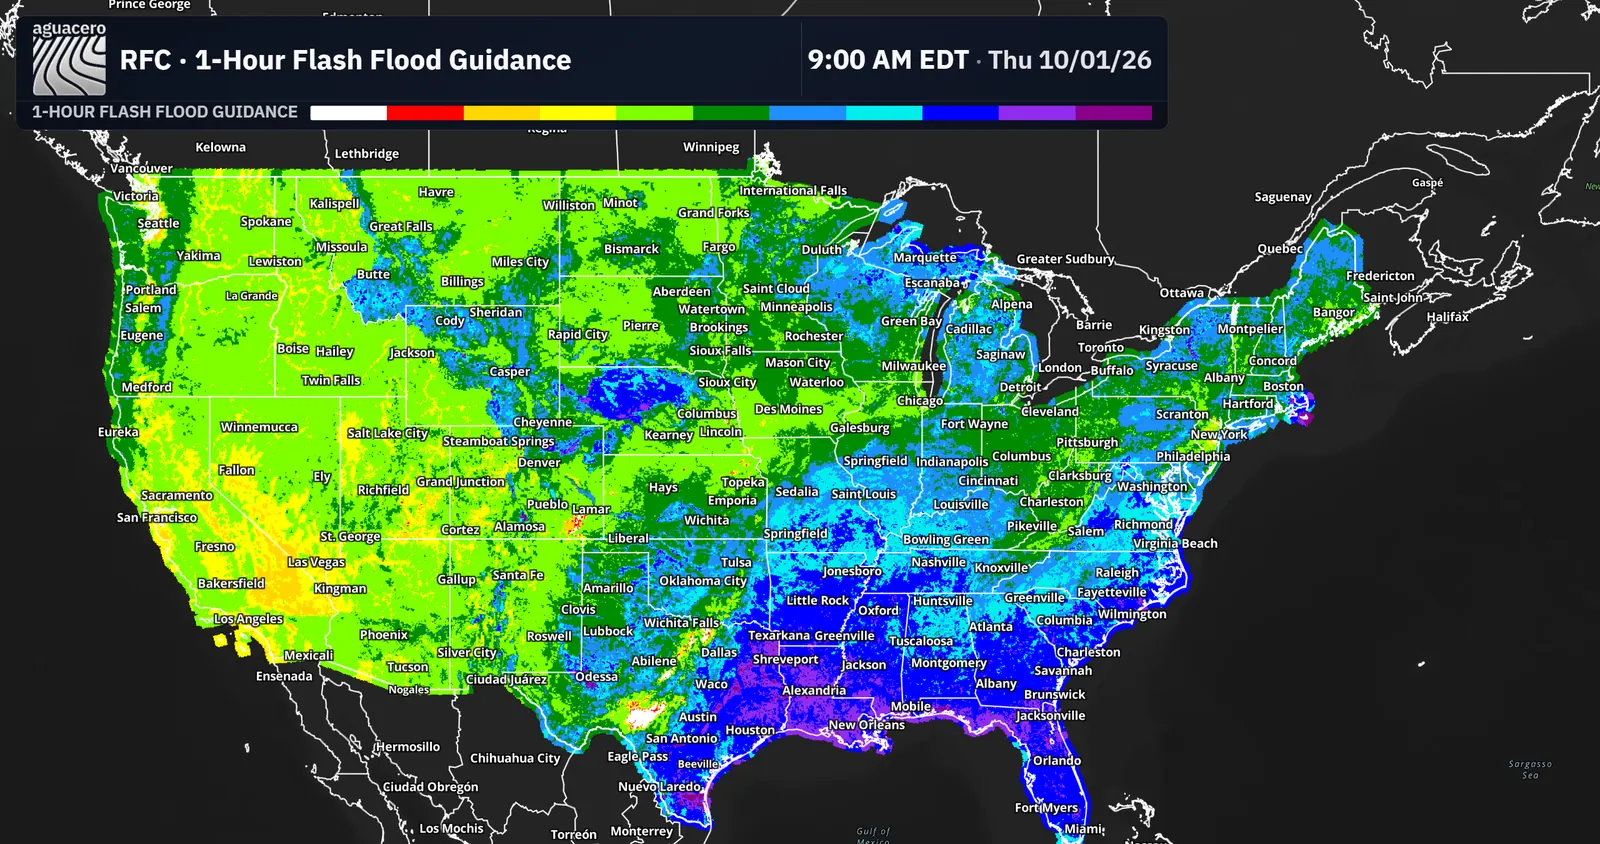
River Forecast Center 1-, 3- and 6-hour guidance for CONUS, and 12-hour for the Mid-Atlantic.
New in 6.9How to use
Short-, medium- and long-range streamflow, soil, snow and runoff for 2.7 million river reaches.
EnthusiastNew in 6.9How to use
NCEP multisensor precipitation at about 4.8 km, with sums from 3 hours to a week.
New in 6.9How to use
SST, tropical cyclone heat potential, SST change and anomalies.
New in 6.10How to use
9 features
Watches, warnings and outlooks from the NWS, SPC, WPC and CPC, plus Canadian and European alerts.
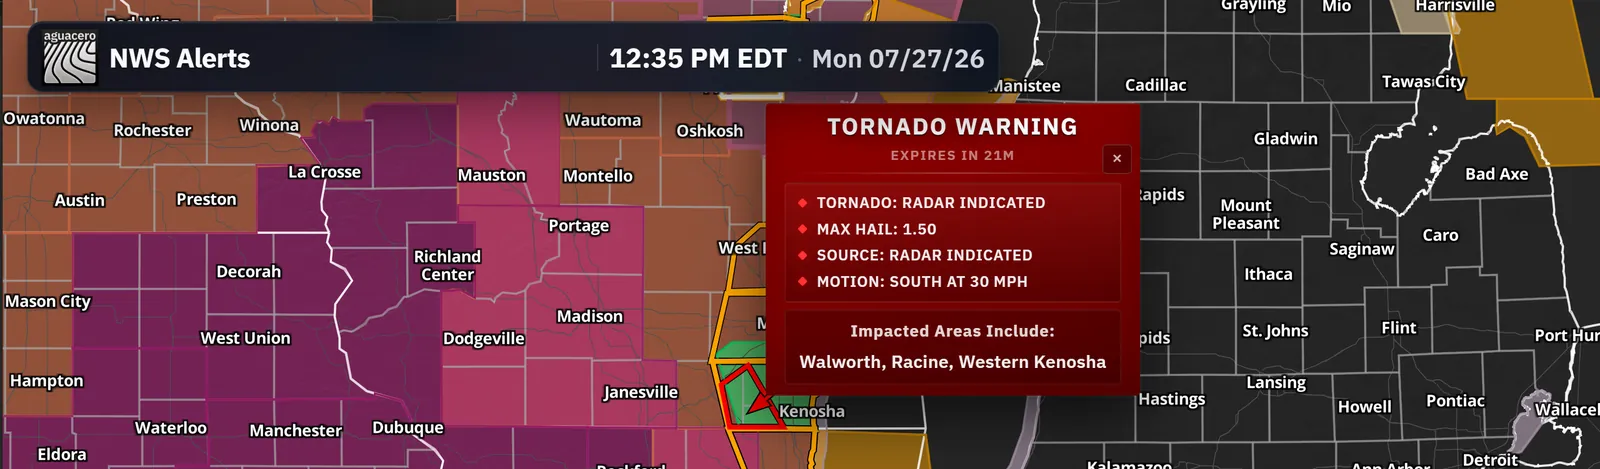
Every NWS alert with your own colors, flashing, sounds and popups that show the population covered. Filter by type, office or state; alerts arrive over NWWS.
ToolbarHow to use
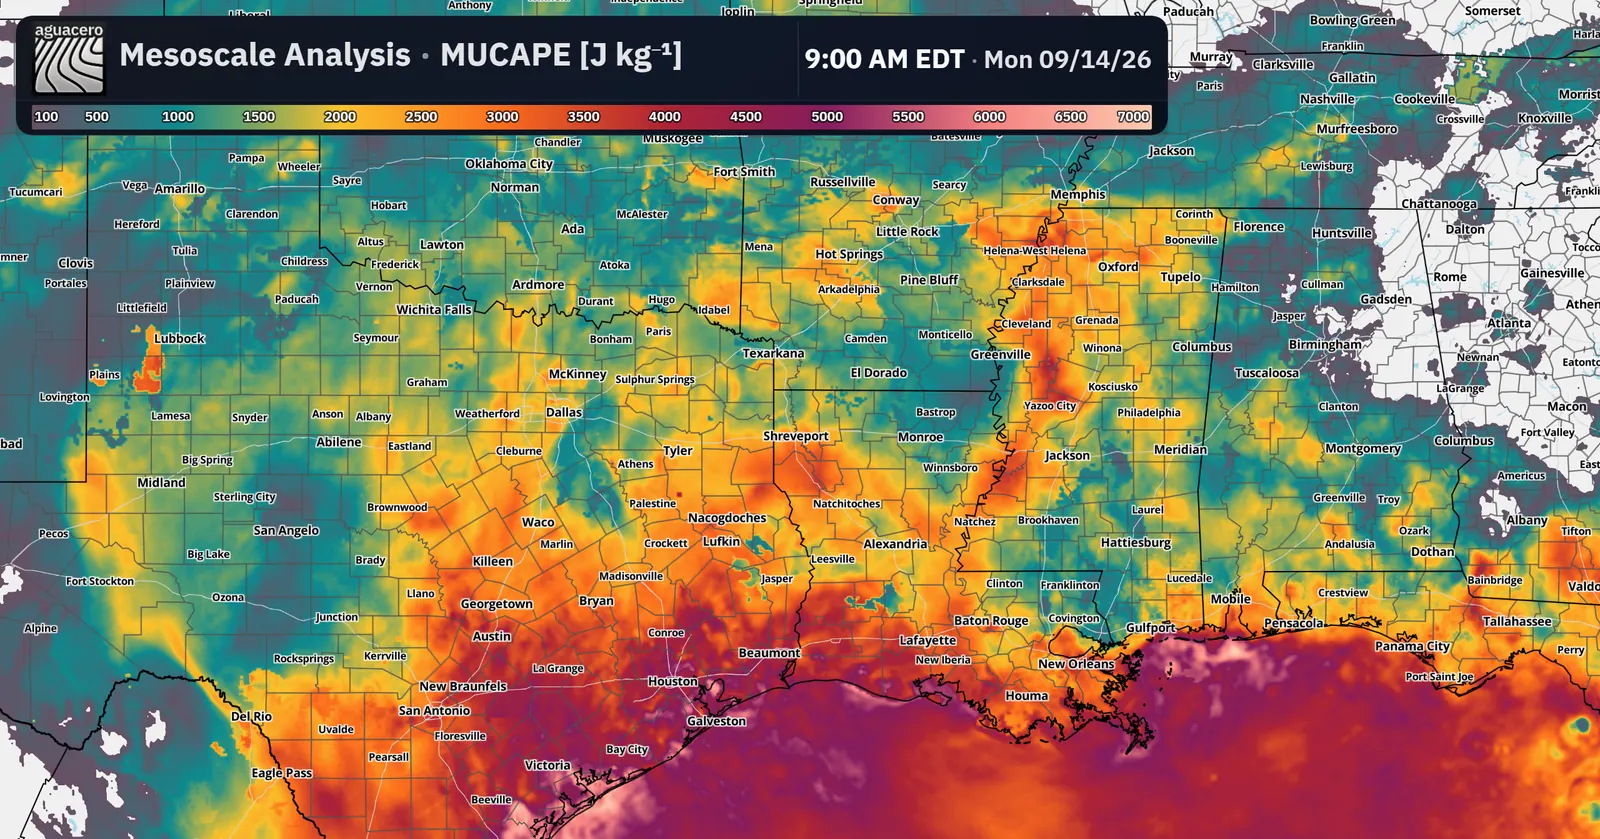
Hourly convective diagnostics on the 3 km HRRR grid. 12 hours back on Free, 24 on Enthusiast and 72 on Professional.
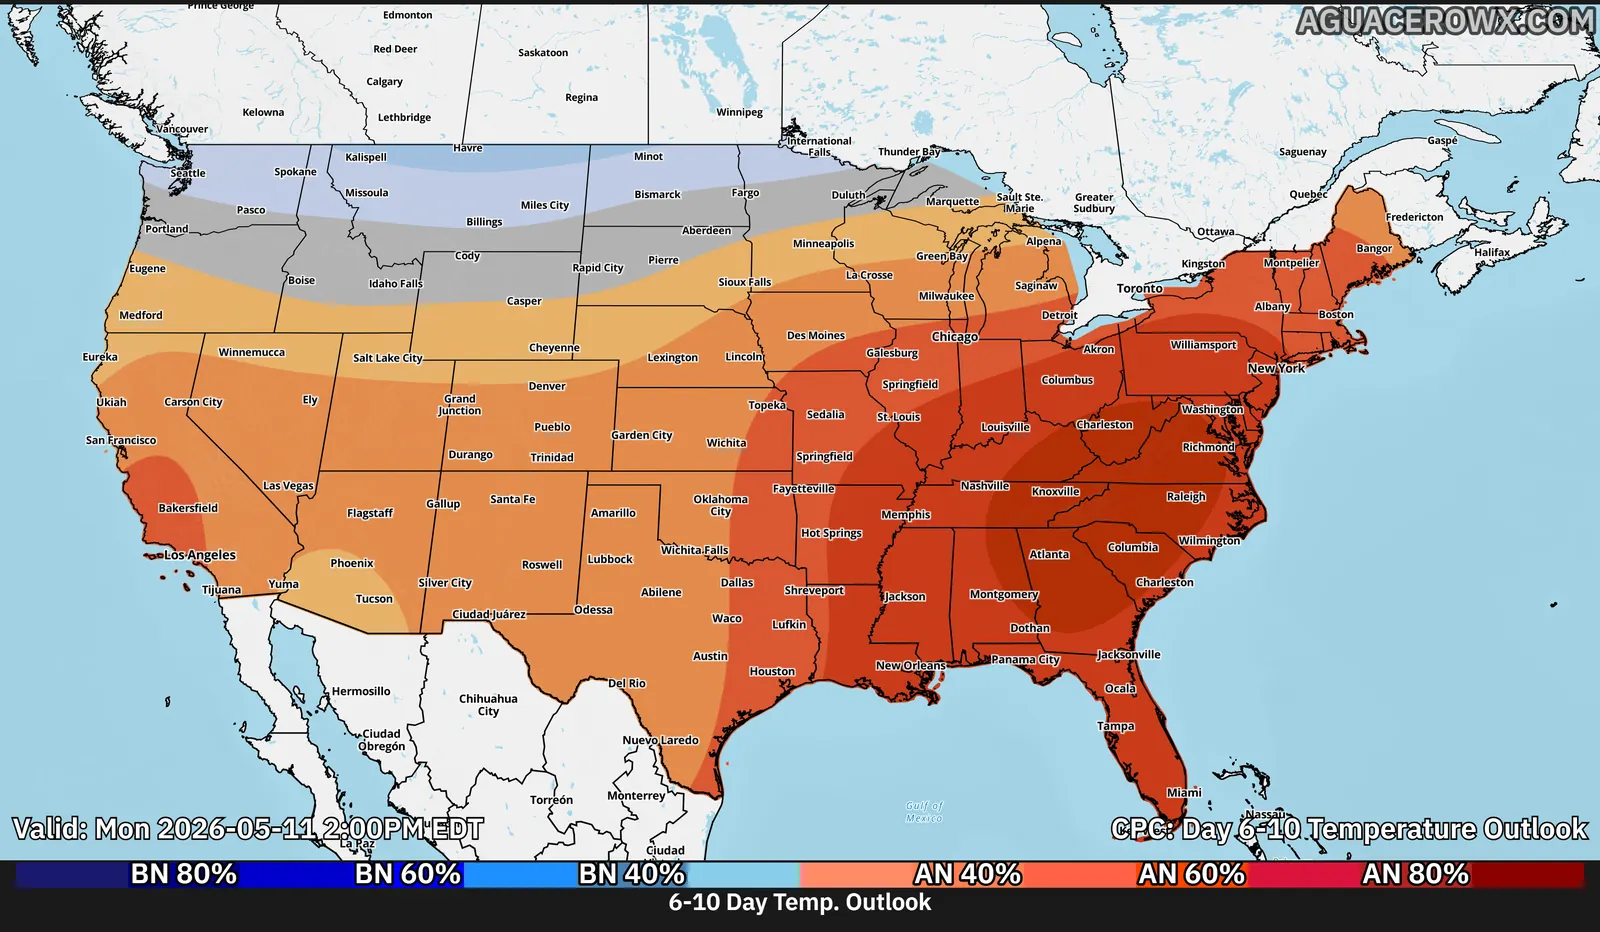
6–10 day, 8–14 day, 1-month and 3-month temperature and precipitation outlooks.
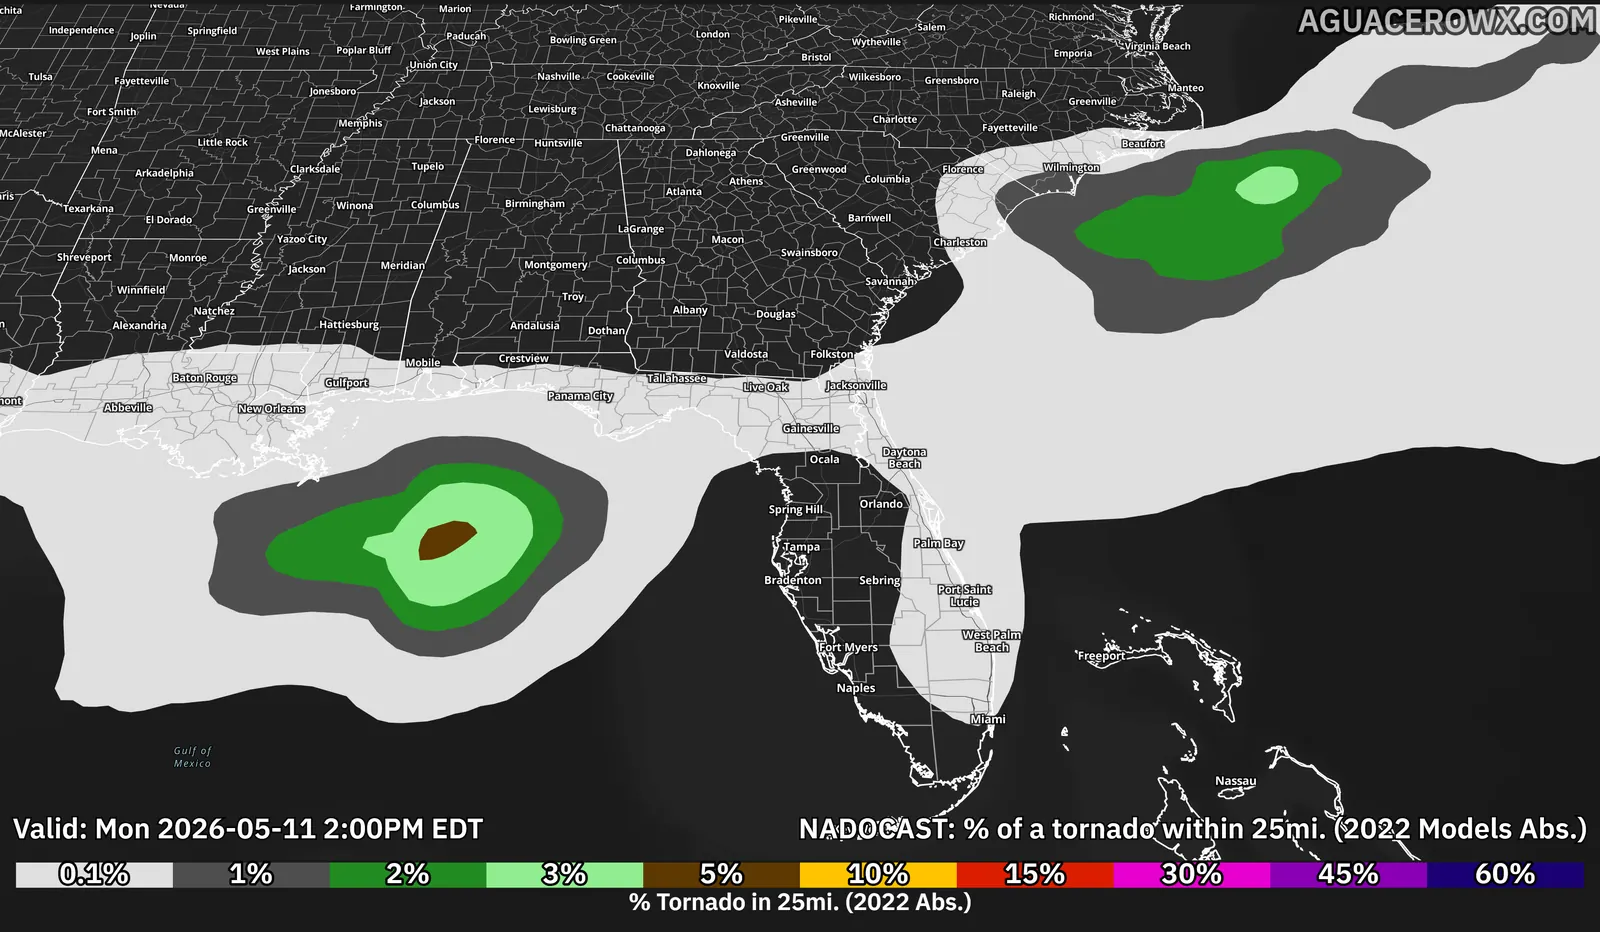
Machine-learning severe weather probabilities, including Day 2 for 12z runs, with run switching.
ToolbarHow to use
ECCC and MeteoAlarm warnings with the same styling and time slider, and a toggle for each region.
New in 6.10How to use
Convective and fire weather outlooks out to day 8, with watches and mesoscale discussions in the alerts layer. Outlooks can follow the time slider.
ToolbarHow to use
Surface fronts, QPF with point readouts, winter weather products such as the WSSI, and the NWS HeatRisk map.
6 features
Hurricane models, ensembles, recon and NHC products, gathered in the tropical cyclone hub.
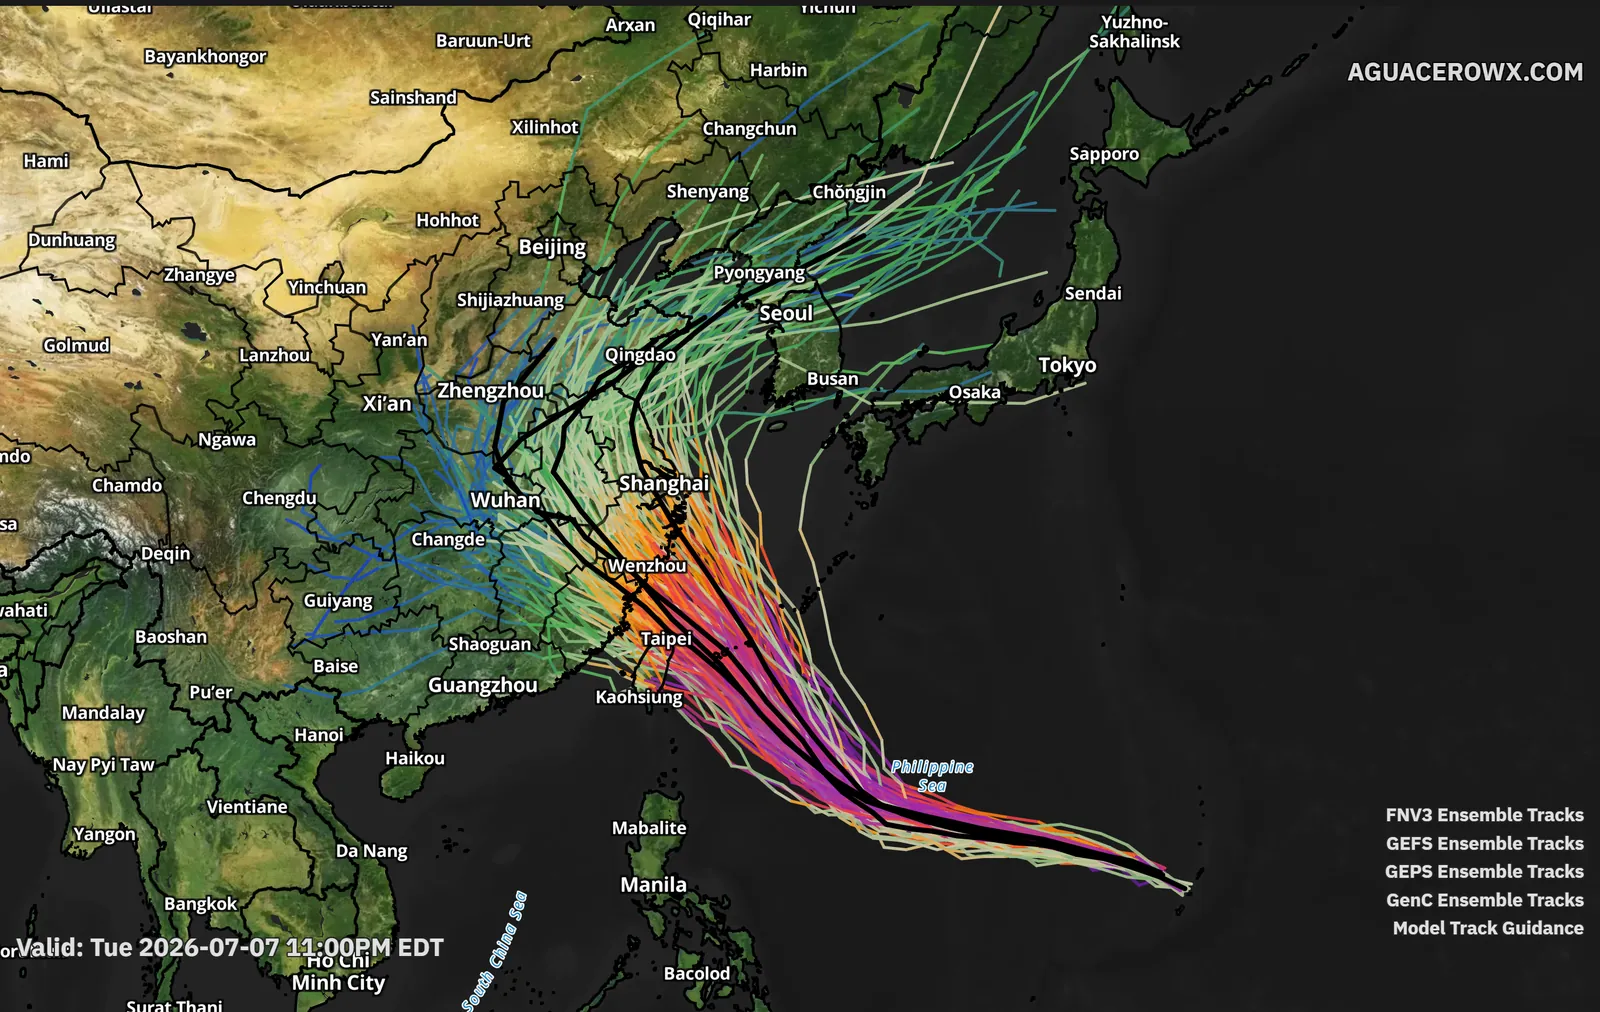
Spaghetti plots from GEFS, GEPS, ECMWF EPS and Google DeepMind’s ensemble, with a name and color for each model.
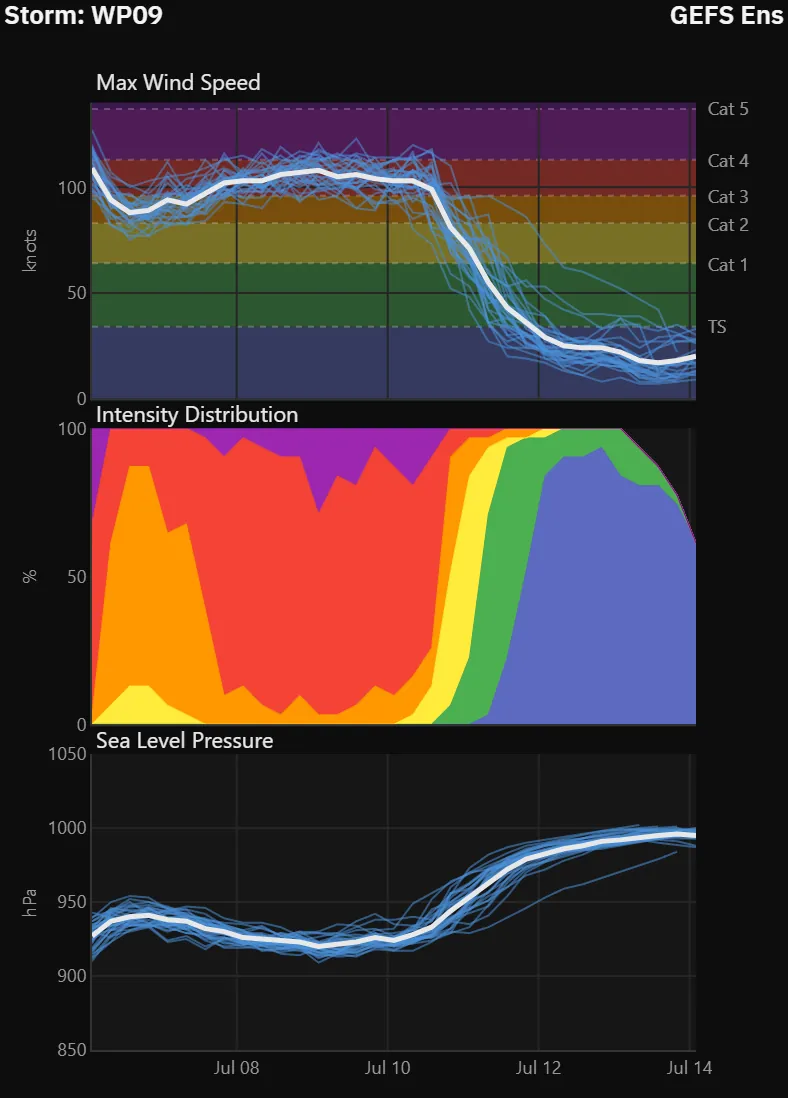
Ensemble maximum wind, intensity distribution and pressure for each storm.
Active storms, forecasts, models, ensembles and recon in one place.
ToolbarHow to use
HAFS-A, HAFS-B, HWRF and HMON with every nested domain and hurricane diagnostics such as MPI and shear, plus an option that keeps the map on a moving nest.
EnthusiastHow to use
Forecast cones and tracks you can restyle, labels you can drag, and a storm popup with the fields you pick. JTWC covers the Pacific.
7 features
Switch from Live to Archive and replay past events with the tools you use every day.
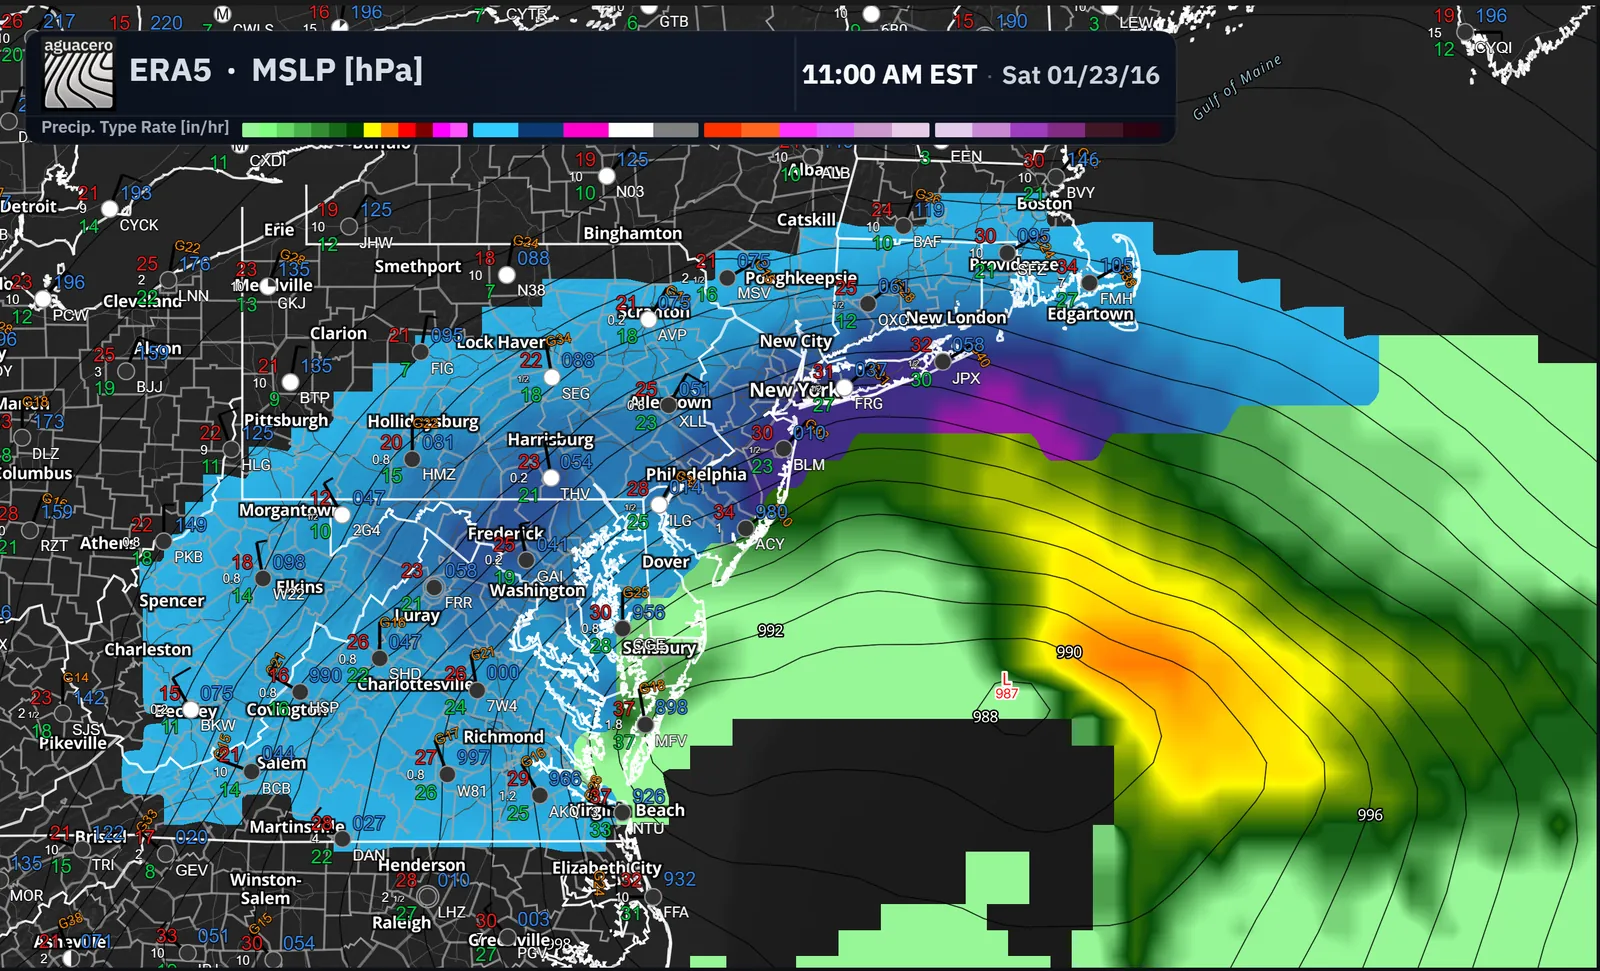
Flip the time bar from Live to Archive, pick an event in the Archive Builder and replay it. Professional loads 24 hours of radar and 5 days of reanalysis at a time.
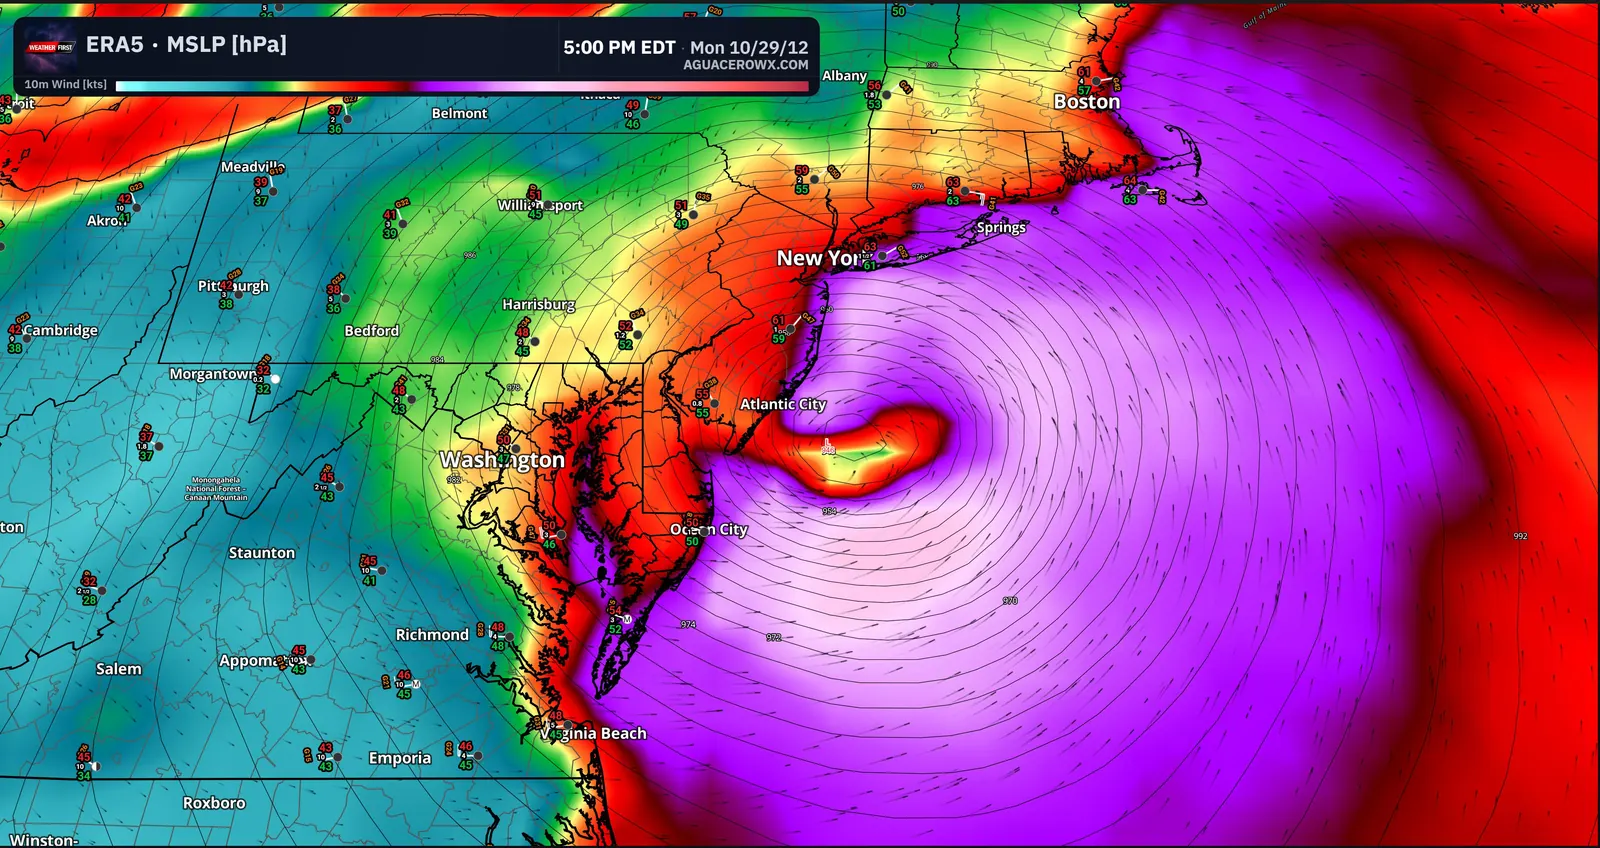
Full ERA5 reanalysis since 1940, including anomaly fields against climatology.
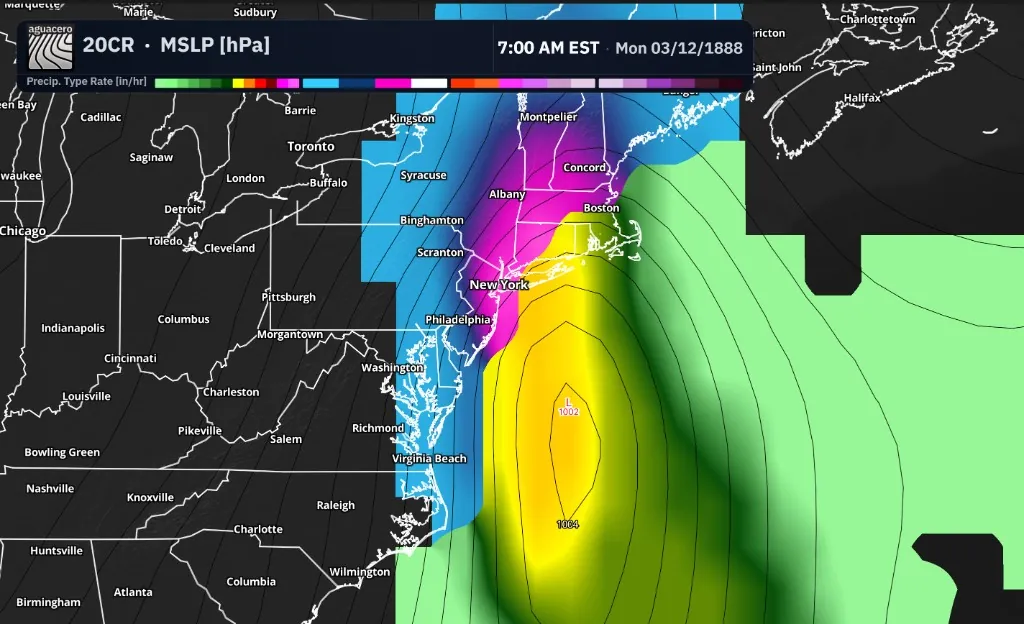
The Twentieth Century Reanalysis, for storms long before satellites and radar.
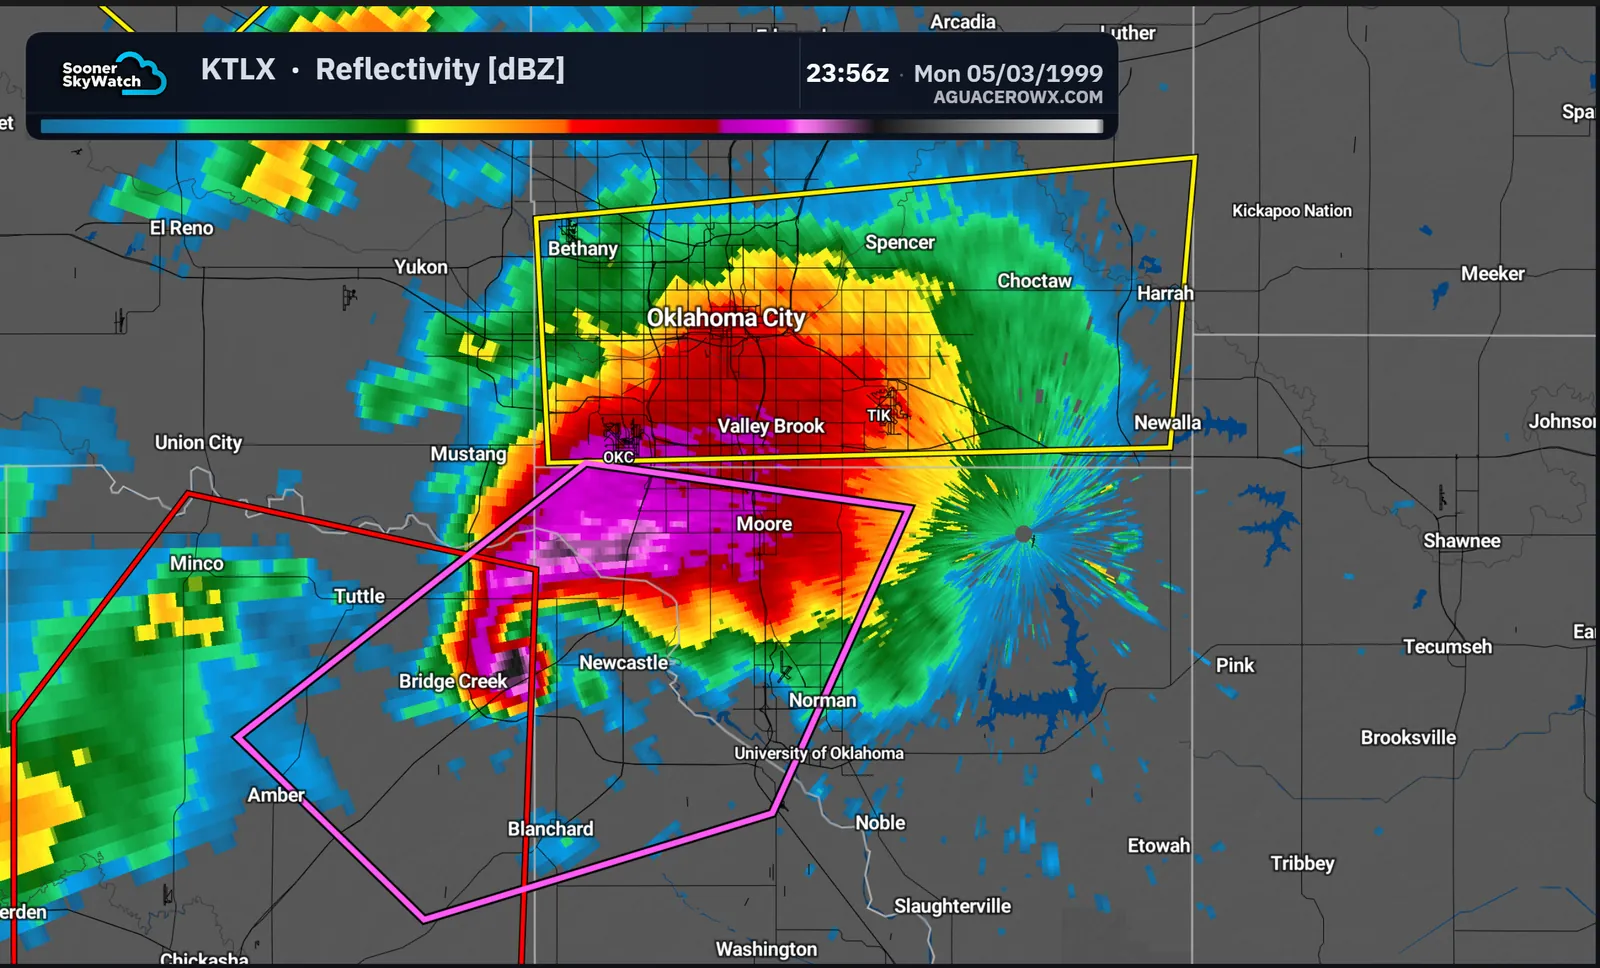
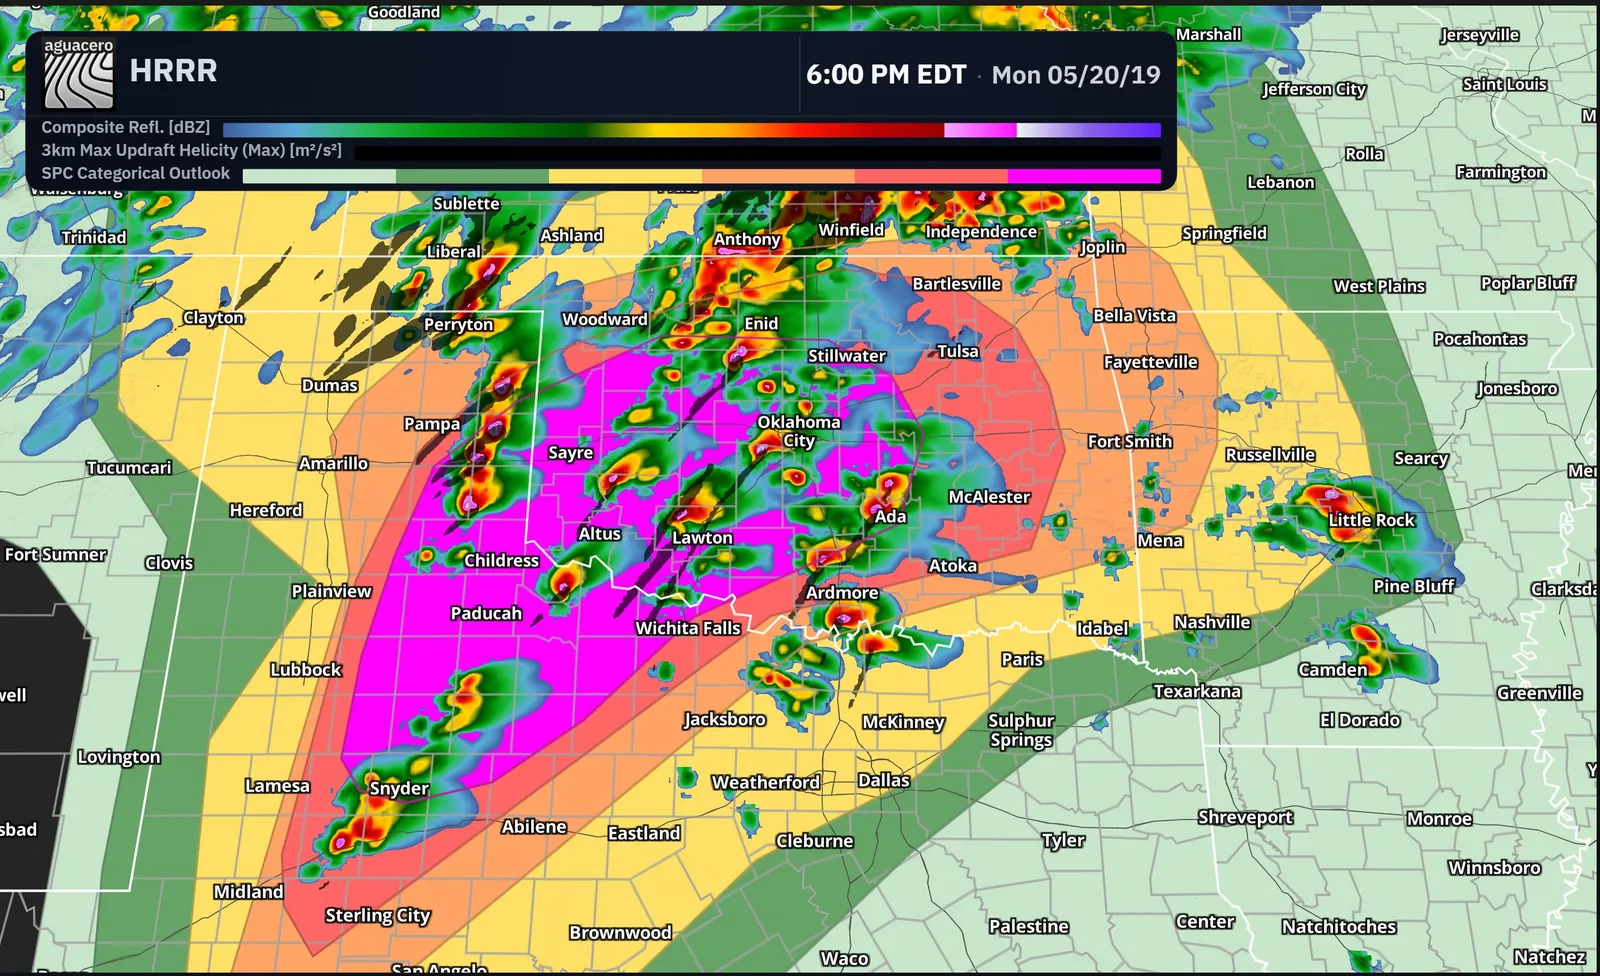
Historical HRRR and GFS runs, with the SPC convective outlooks issued at the time.
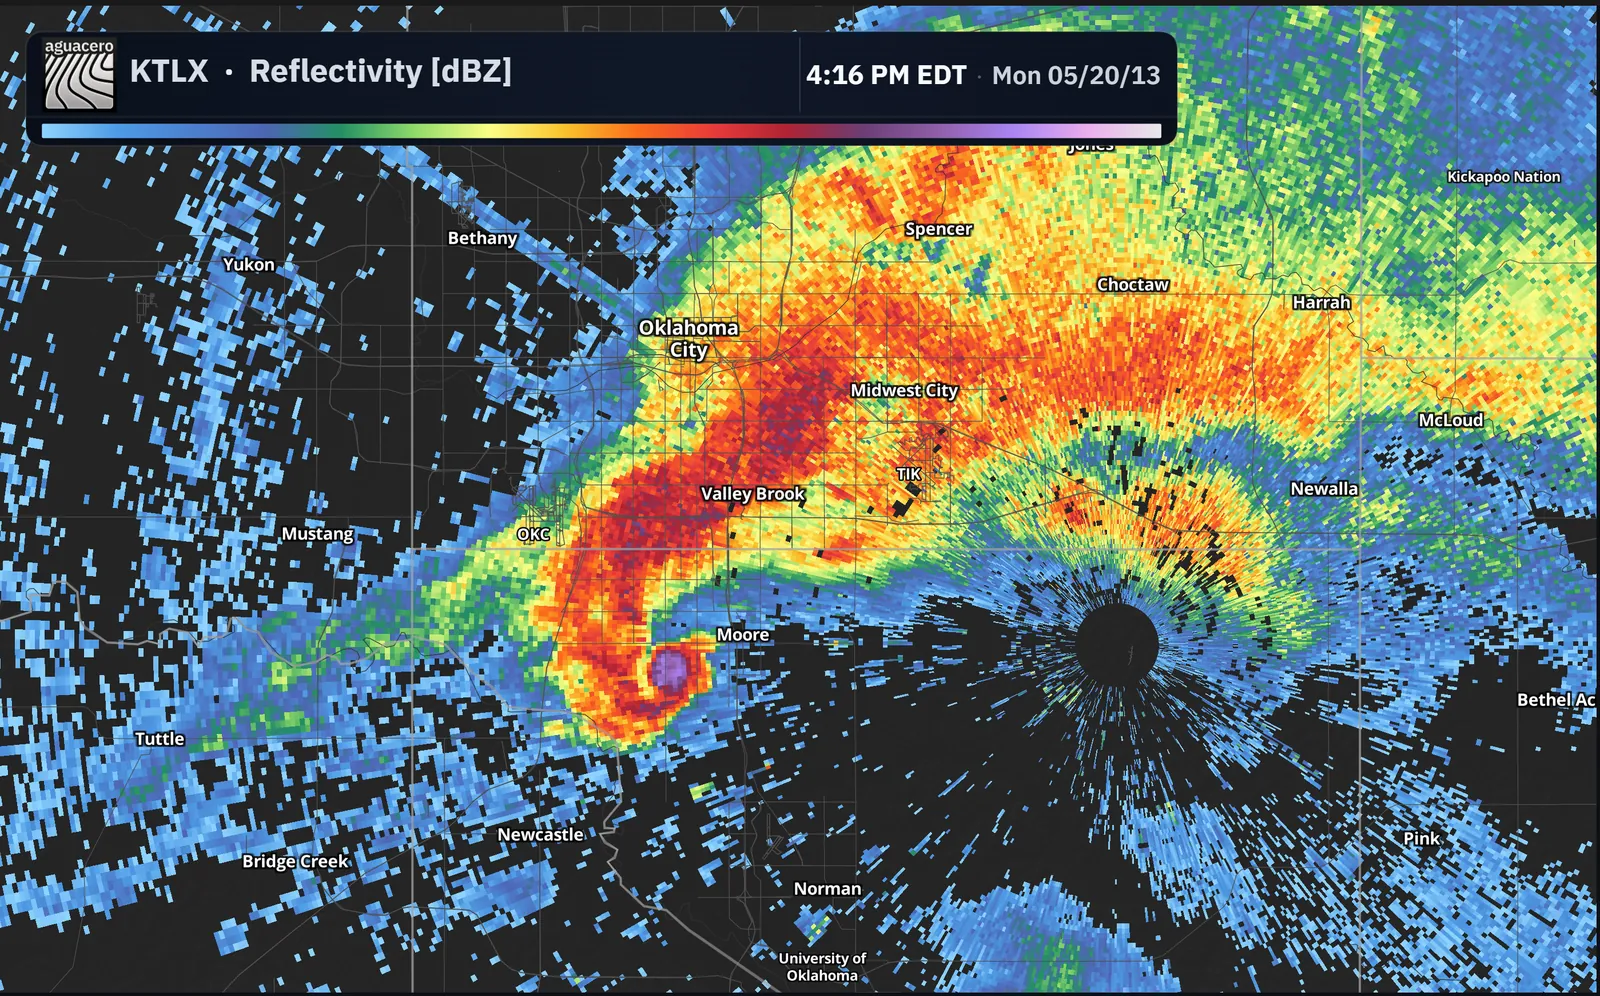
Save an event to come back to: 1 on Free, 5 on Enthusiast, unlimited on Professional.
ASOS back to 1900, storm reports from 2003, NWS alerts from 1986, ACARS from 2019, and historical RAOBs.
15 features
Panels, boards, bundles and workflows that keep your whole setup one click away.
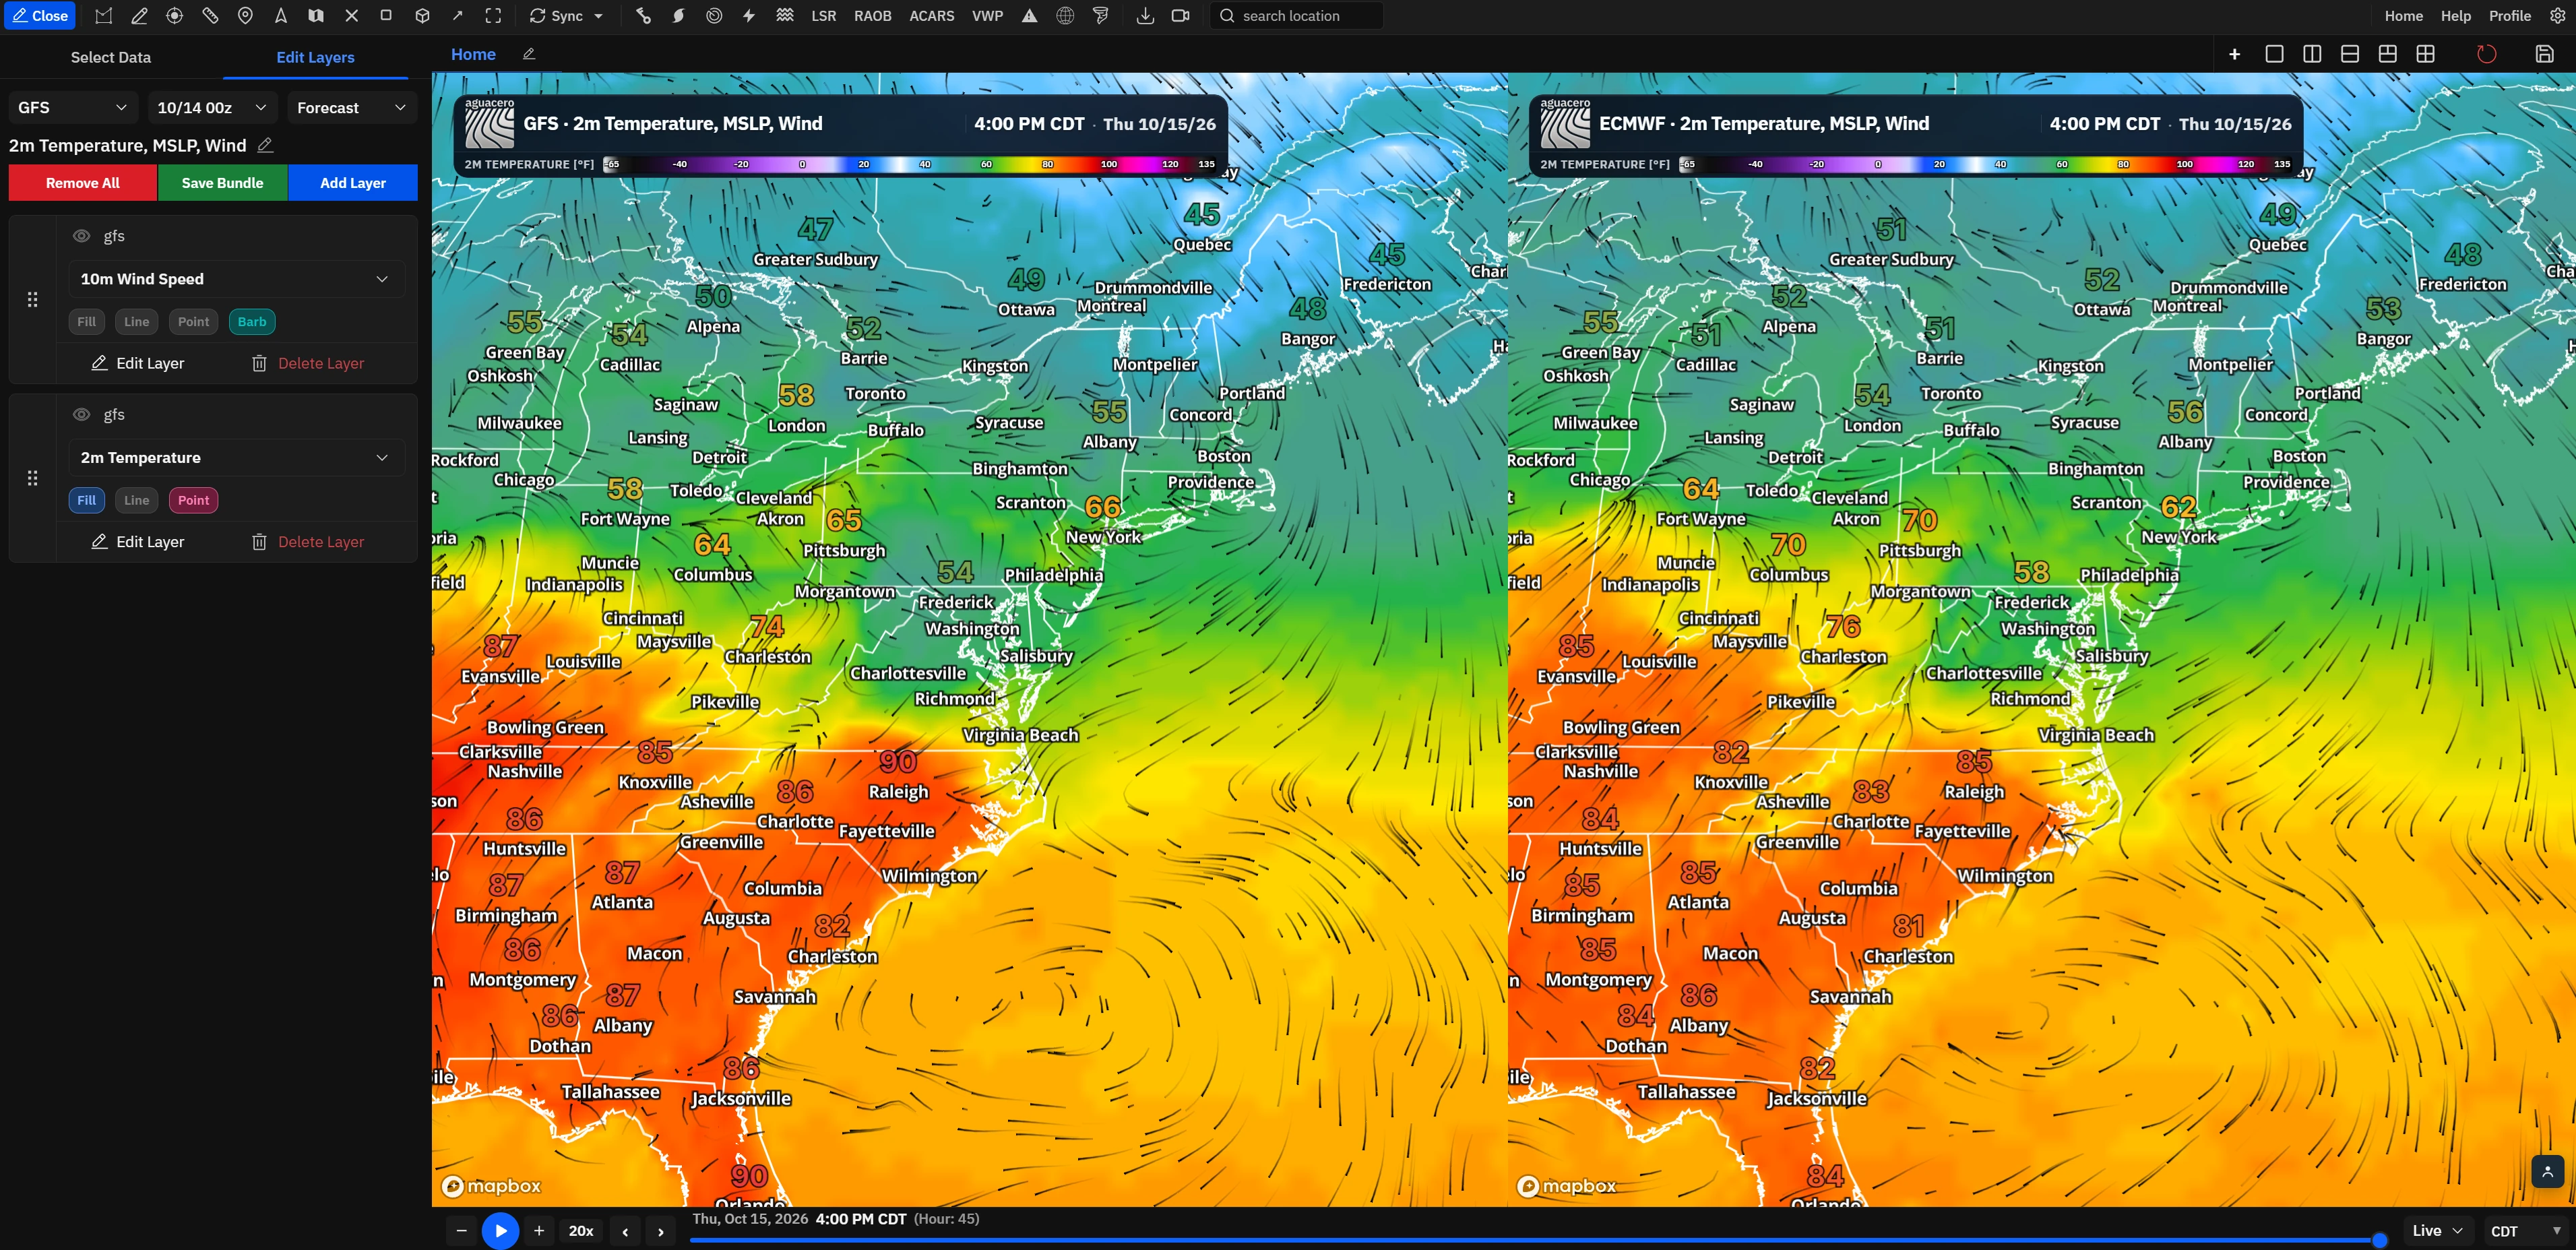
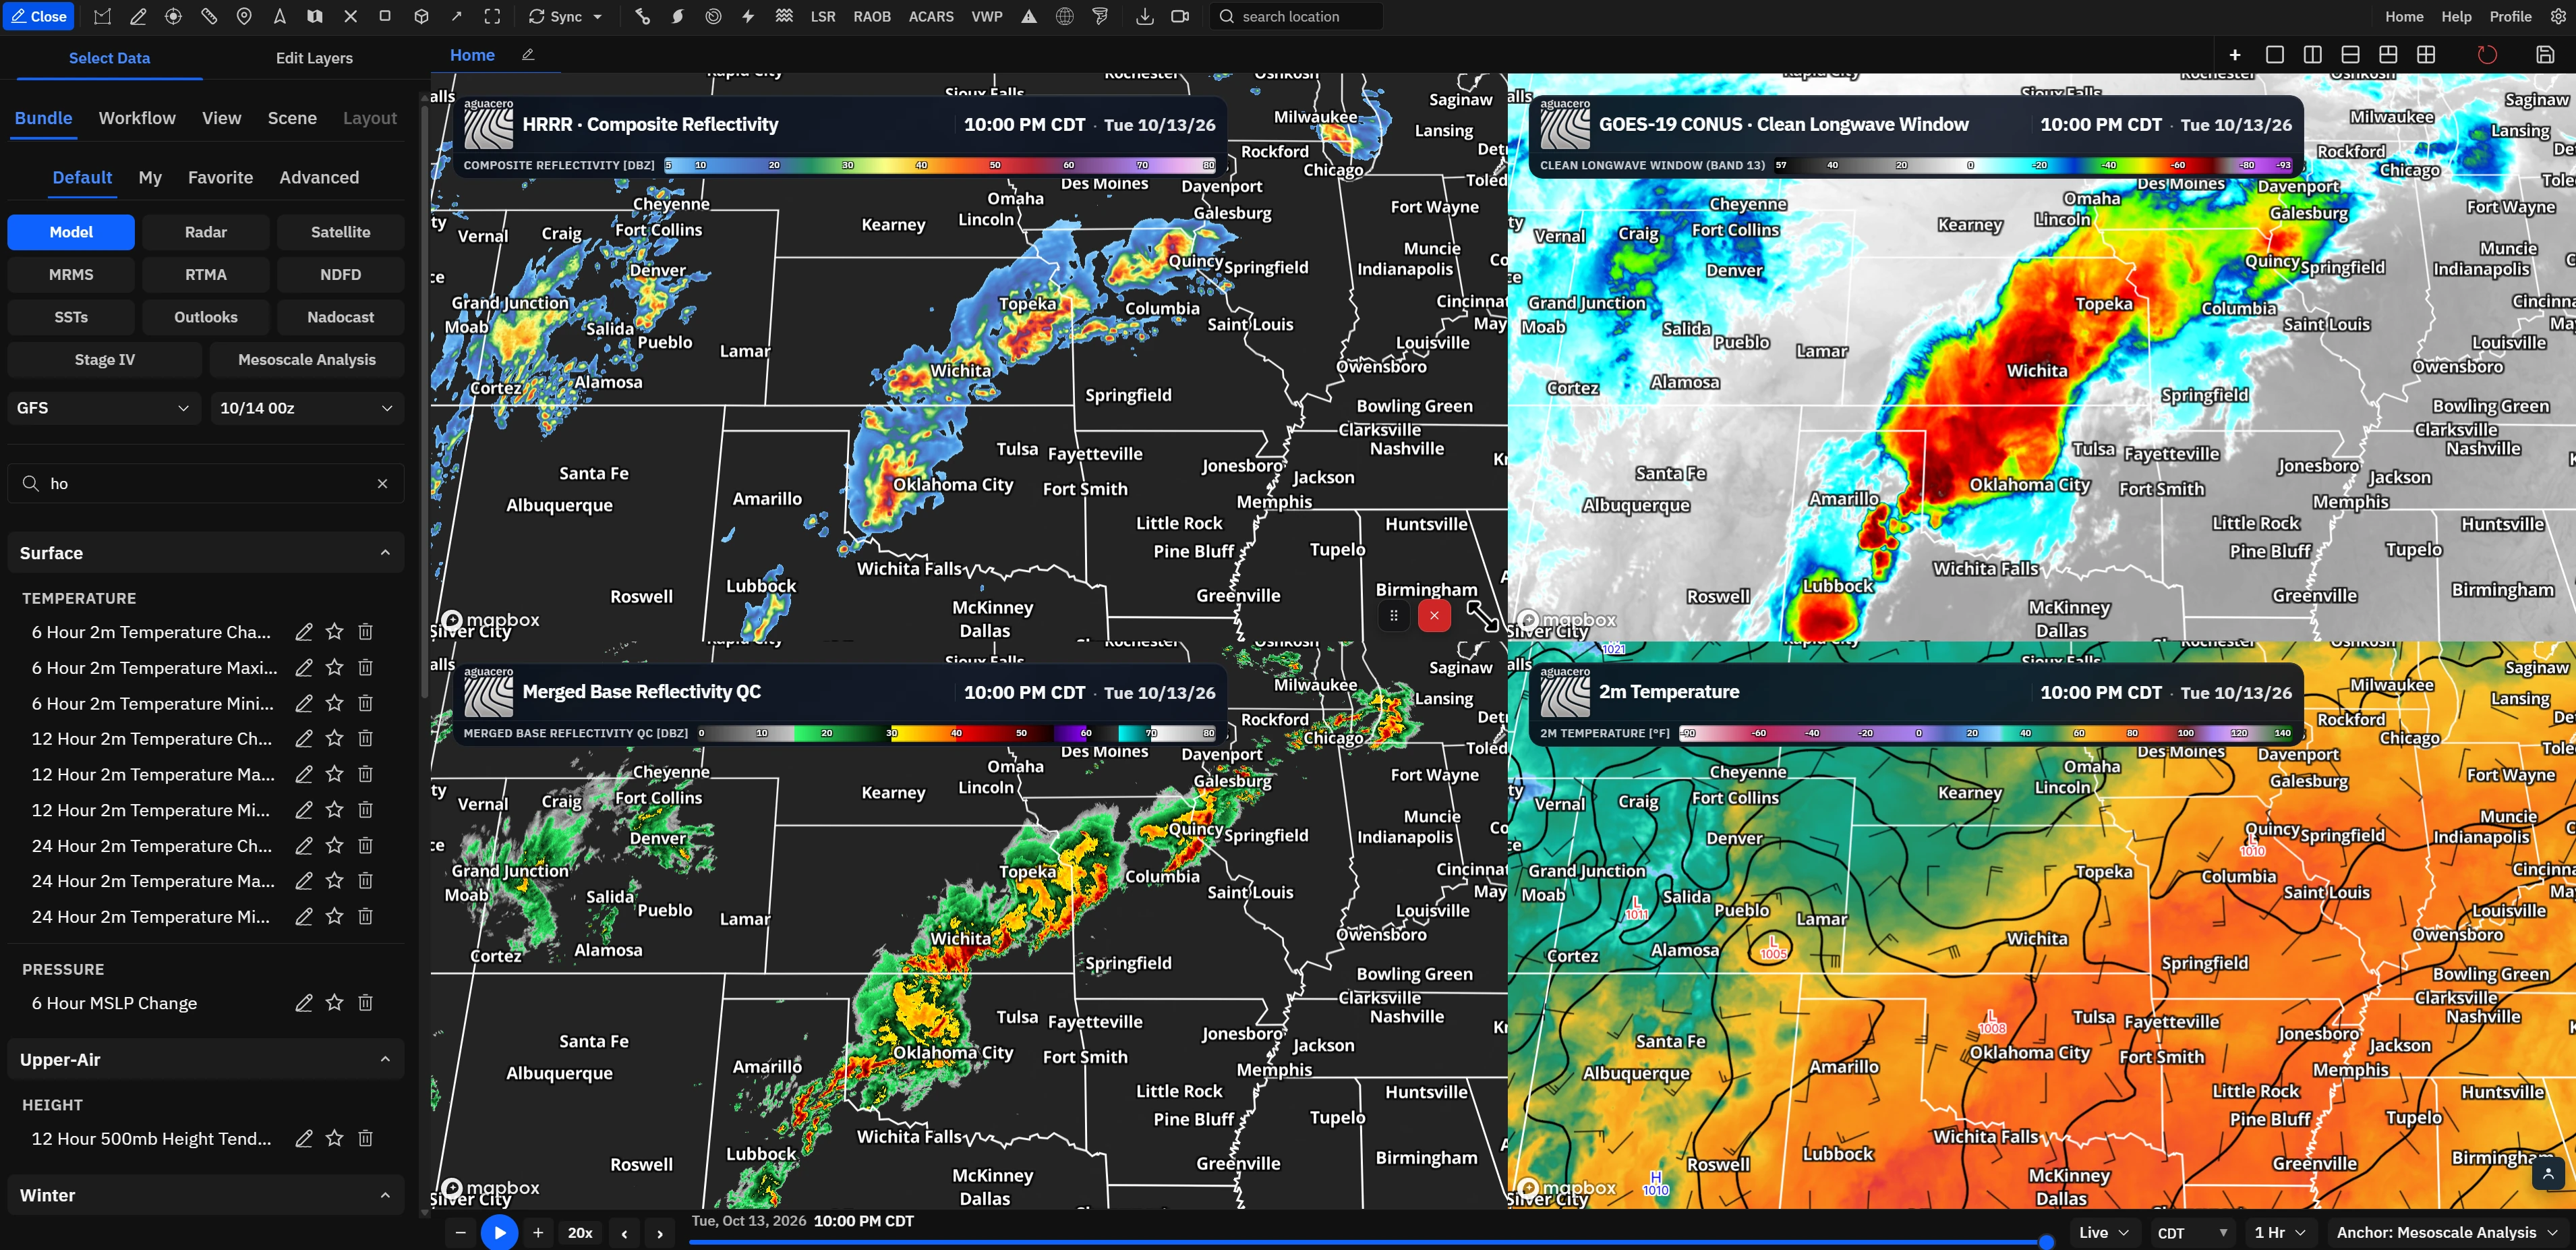
Split the map into panels that share time, pan and zoom: 1 on Free, 2 on Enthusiast, unlimited on Professional.
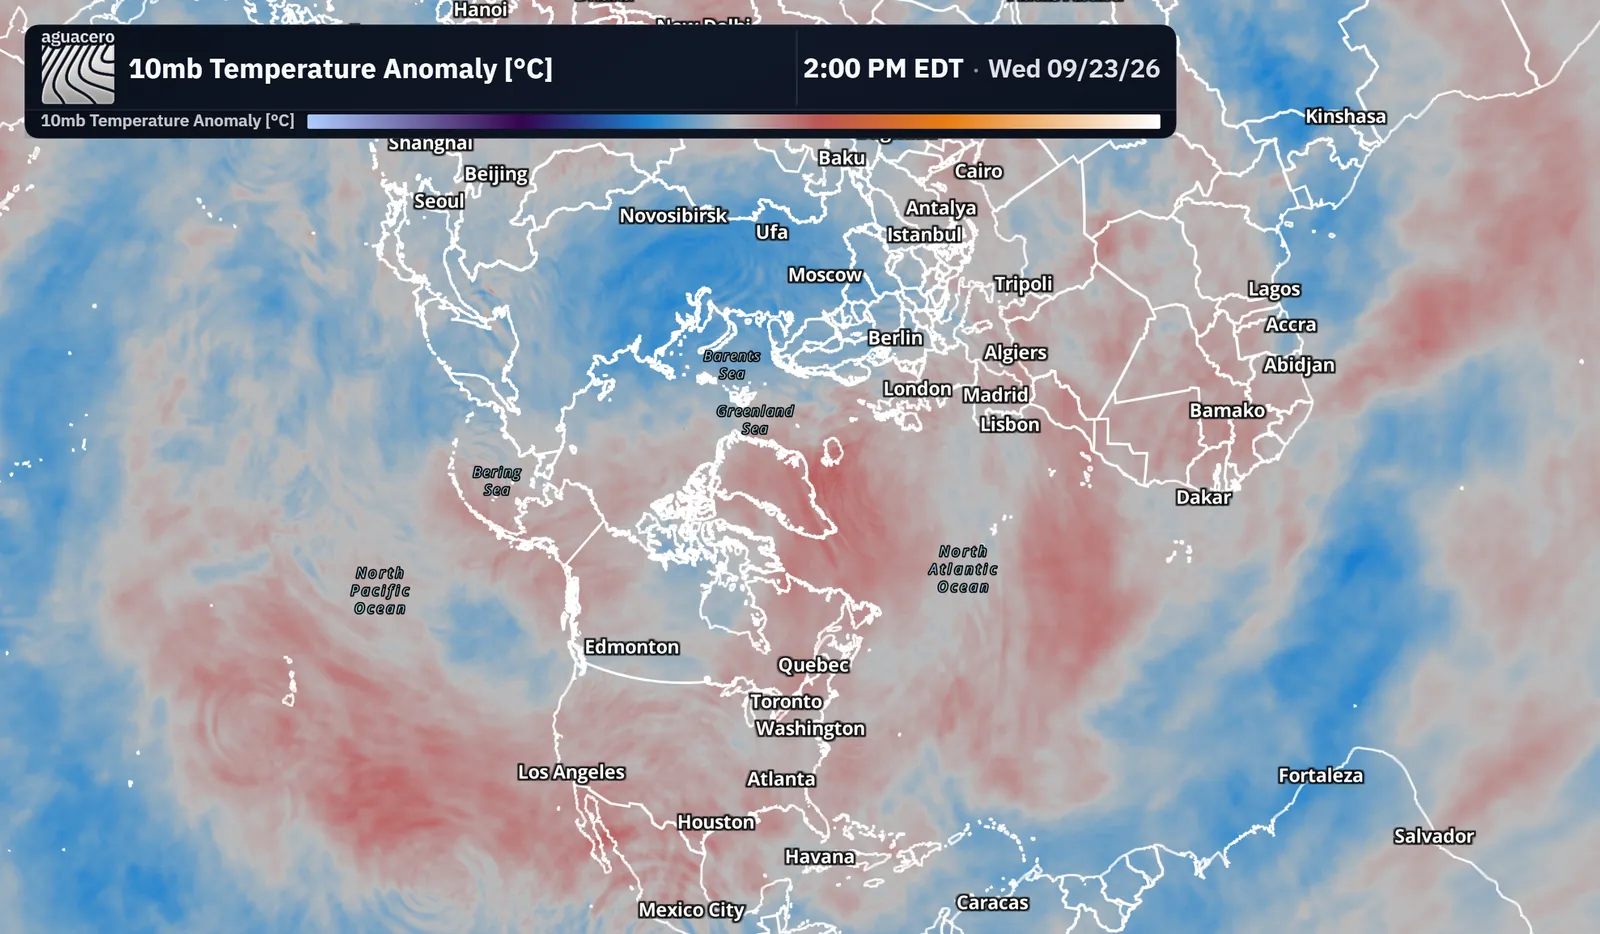
Mercator, a globe, and north and south polar stereographic views.
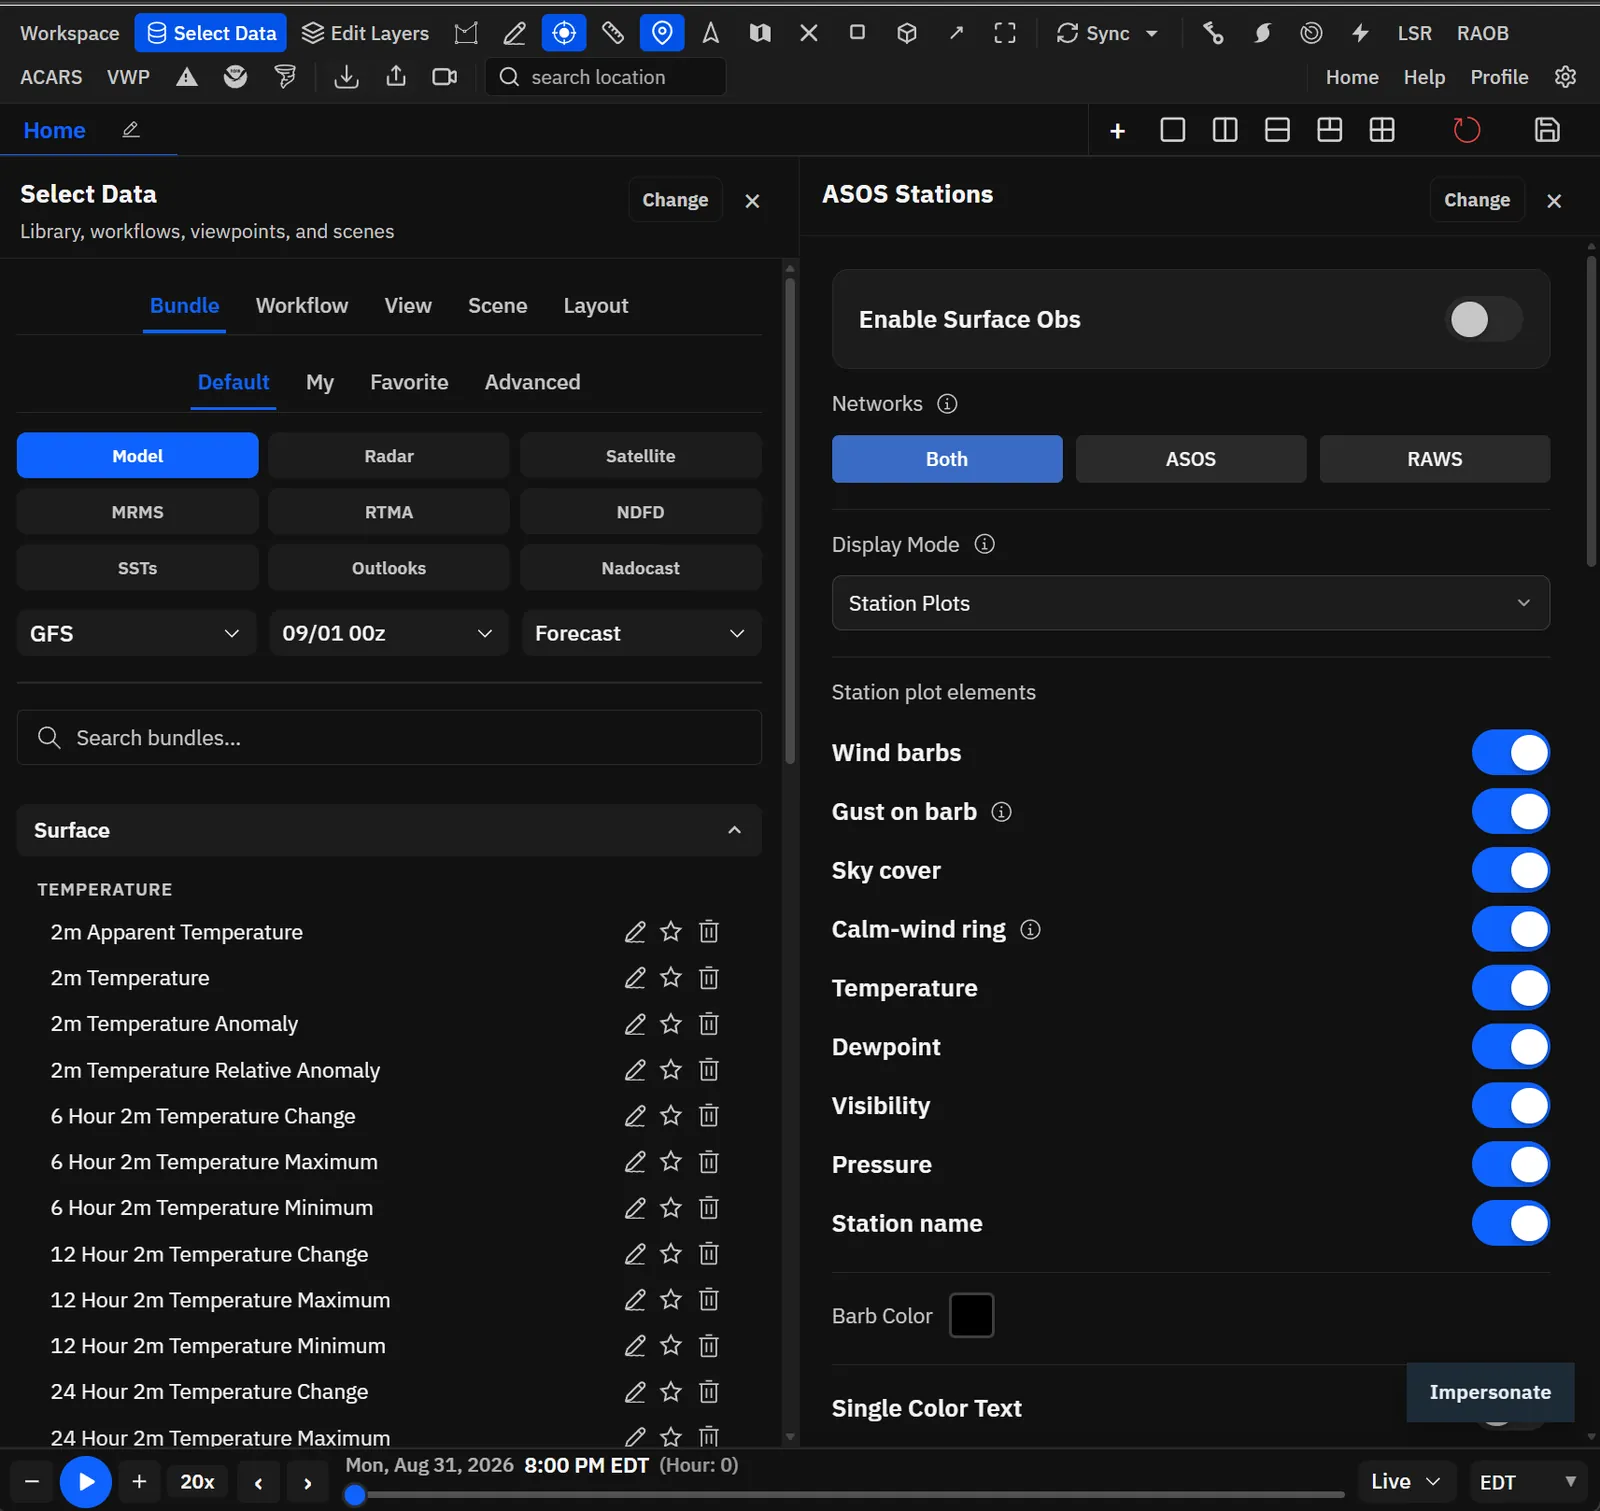
Move the toolbar, sidebar and time bar into their own window, in the browser or the desktop app.
ProfessionalHow to use
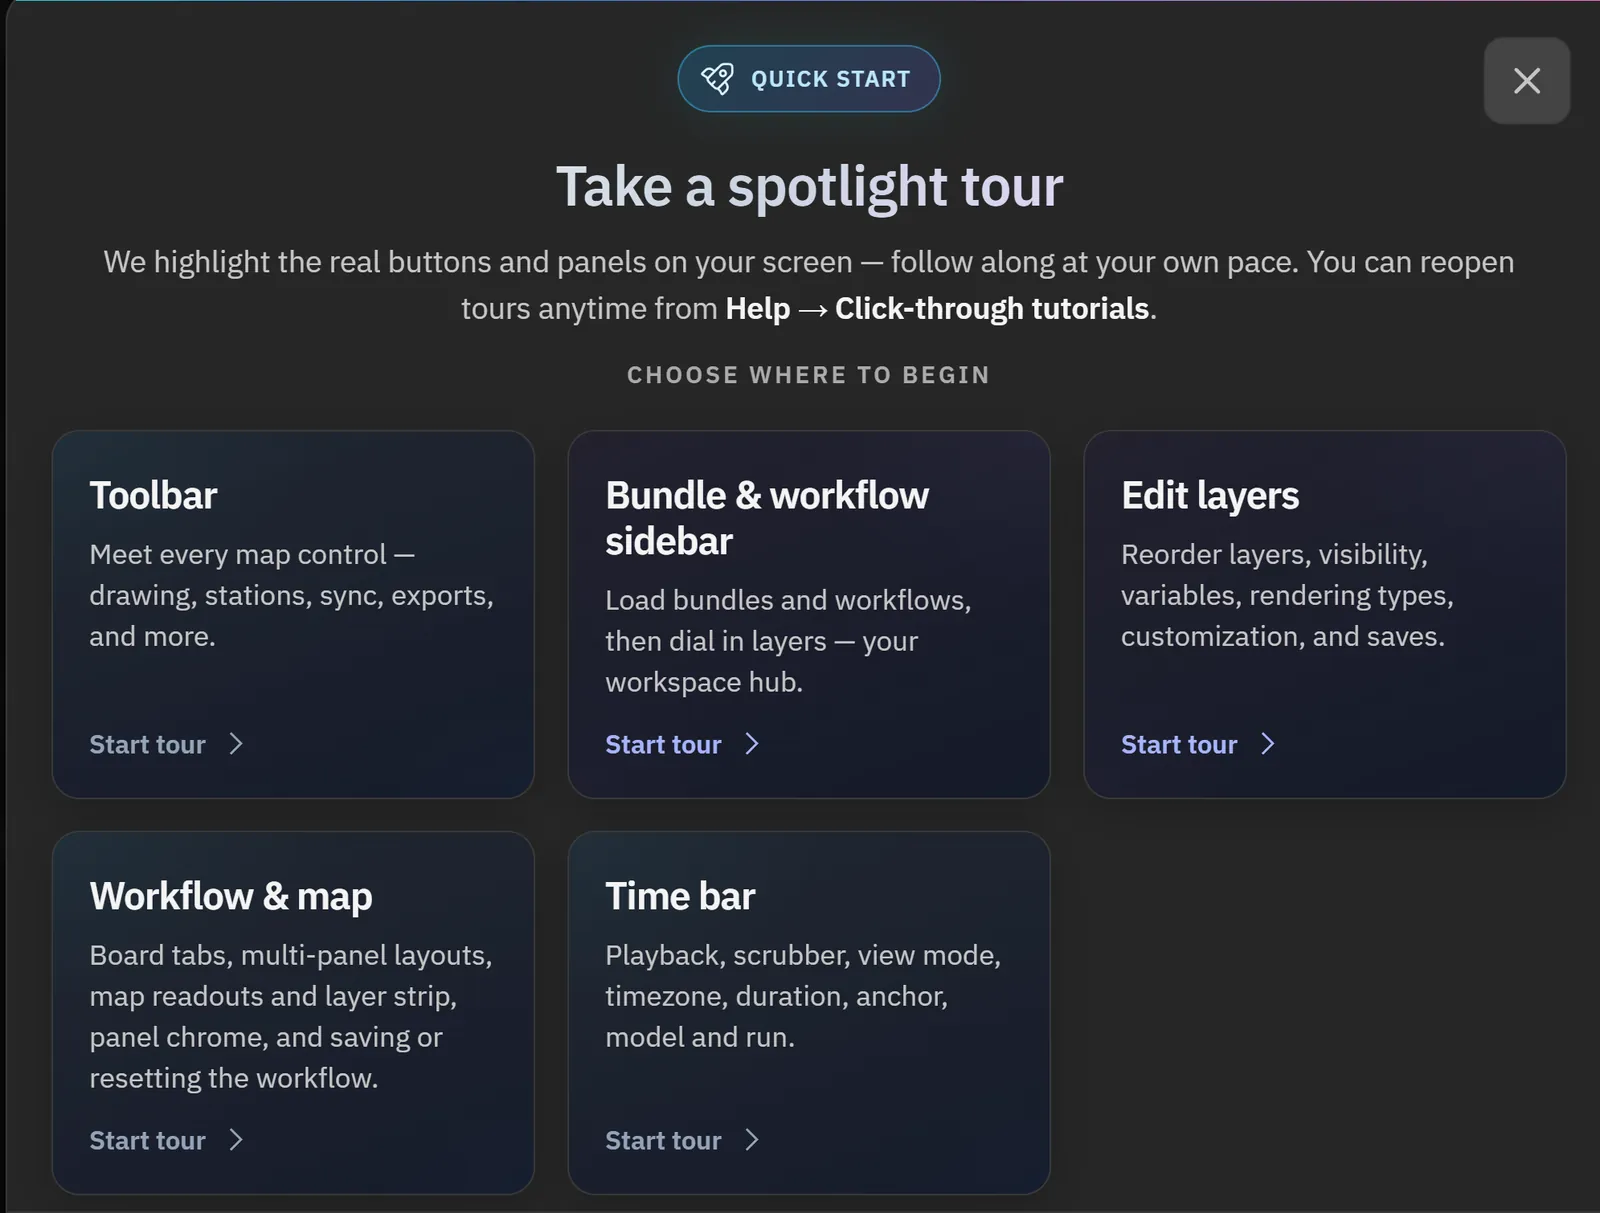
Guided tours of every part of the app, plus FAQs and info boxes in Help.
ToolbarHow to use
Save layers, styles, settings, the model and the viewpoint together, and reopen them in a click: 1 on Free, 10 on Enthusiast, unlimited on Professional.
Add, reorder and restyle layers, and search every model for the layer you need.
ToolbarHow to use
Default, personal and public bundles, workflows and map styles, searchable, with favorites and your own categories.
Remap any keyboard shortcut, choose which toolbar tools appear, and trim or reorder the right-click menu.
Units, time zone, 12- or 24-hour time, language, performance, defaults and appearance in one place.
ToolbarHow to use
Search every feature from the toolbar or the Help menu. The app points at the control and shows the steps.
ToolbarHow to use
10 features
Colors, contours, readouts, basemaps and your own layers. Most styling is on every plan.
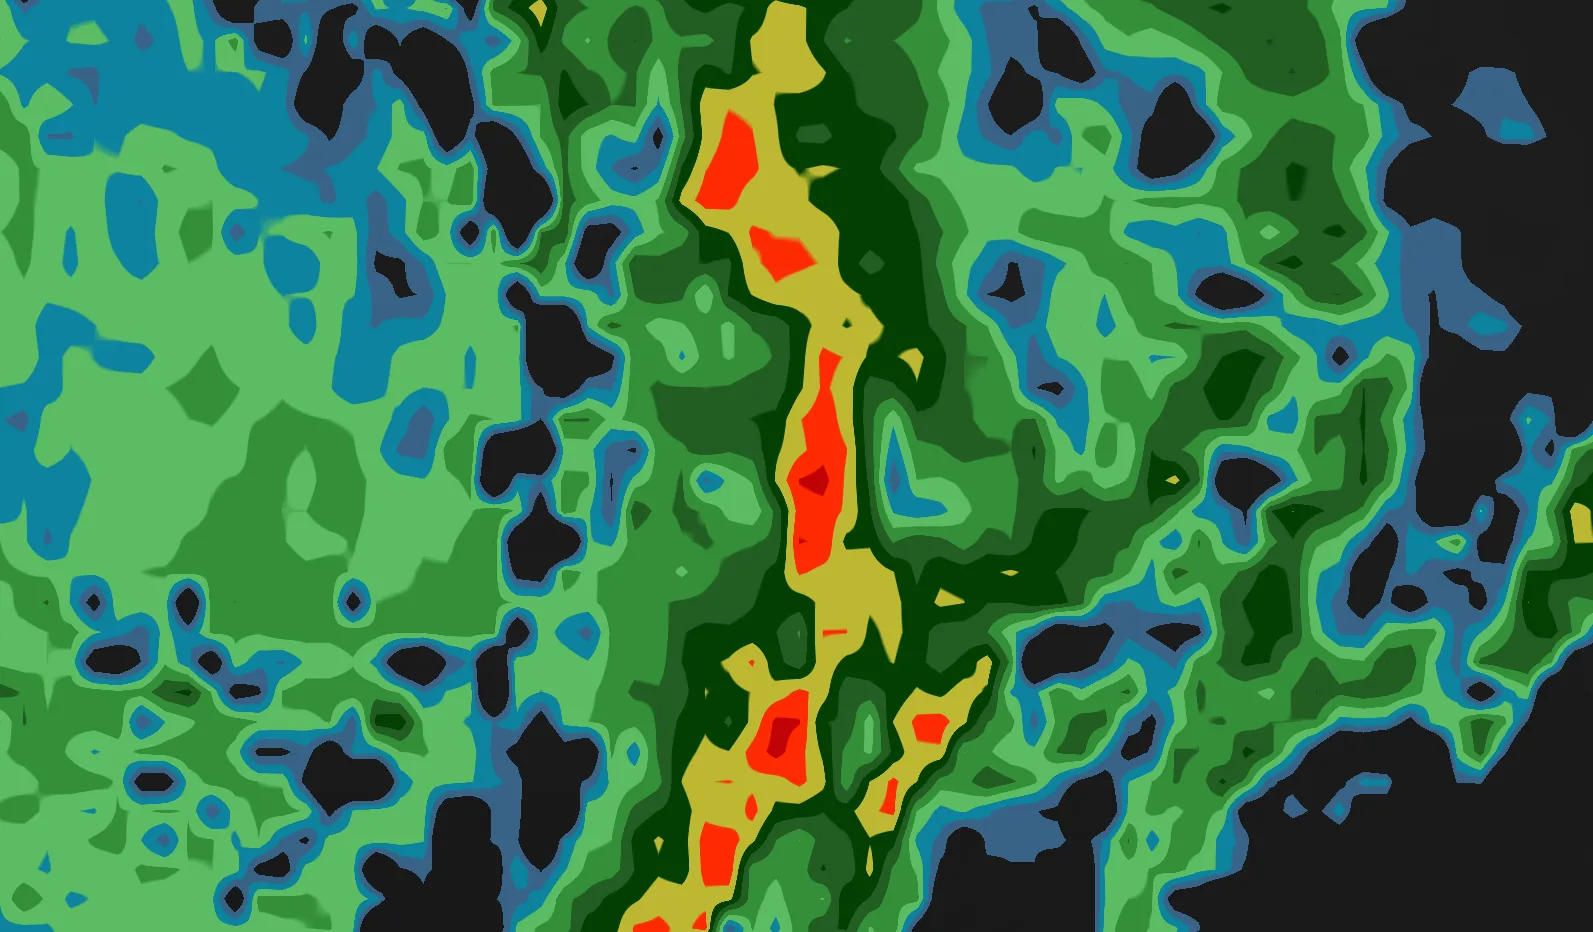
Your own breakpoints, opacity at each stop and smooth or hard steps. Import .pal files or color tables from Wx Tools.
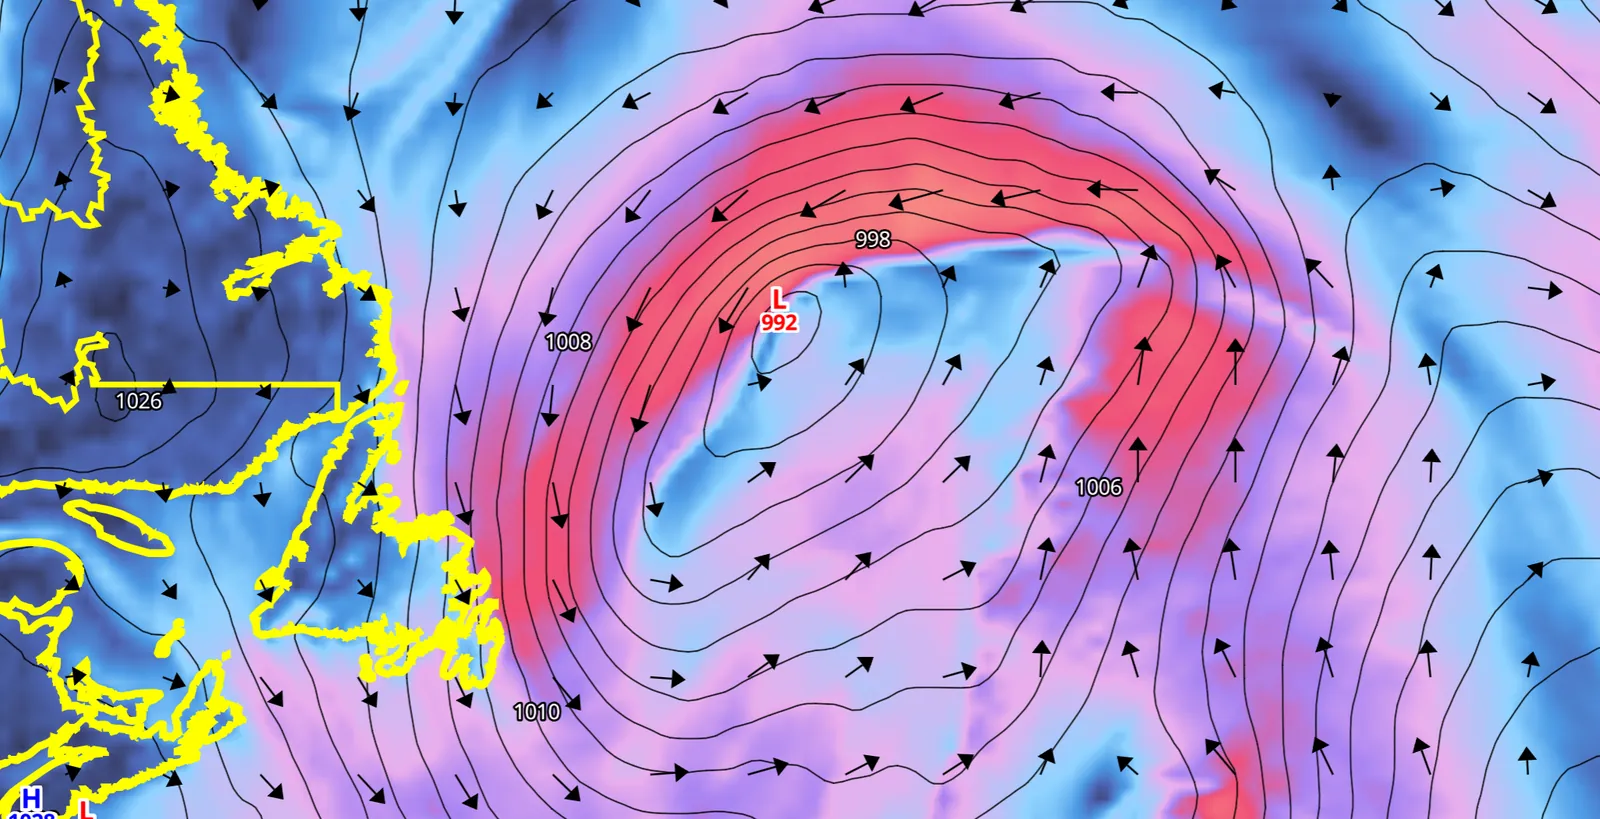
Show wind as barbs or vectors on a grid or at cities, or as animated particles and streamlines.
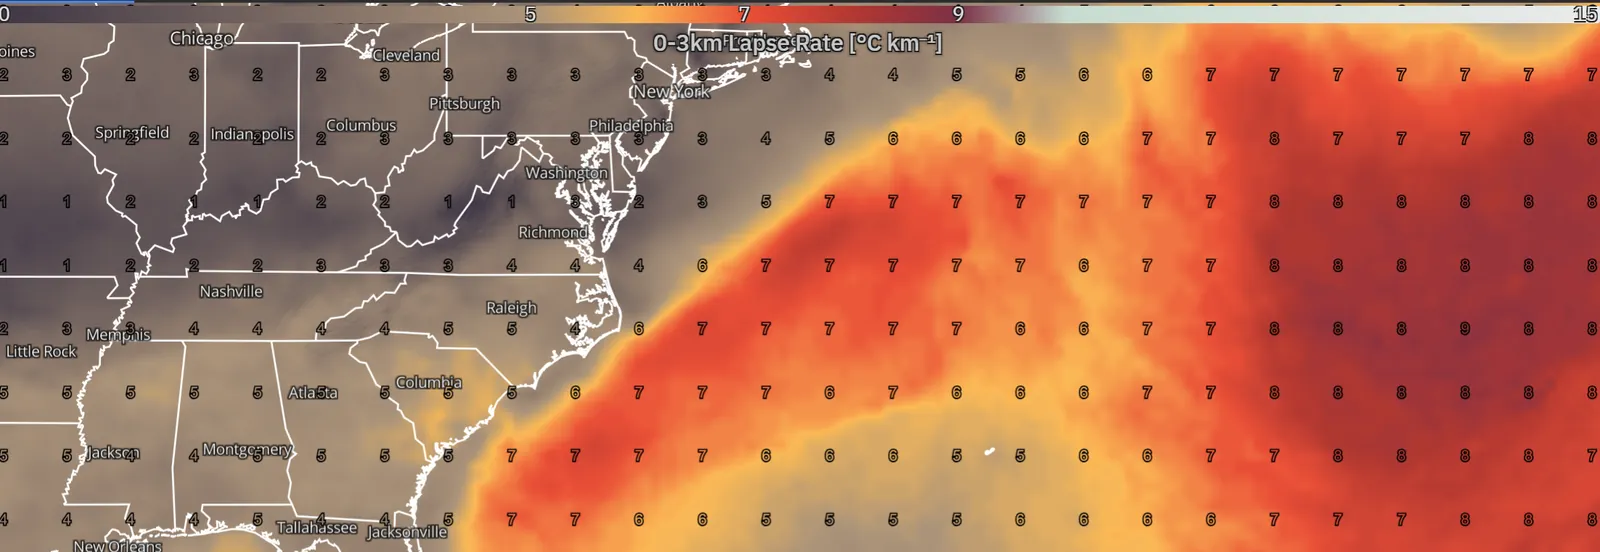
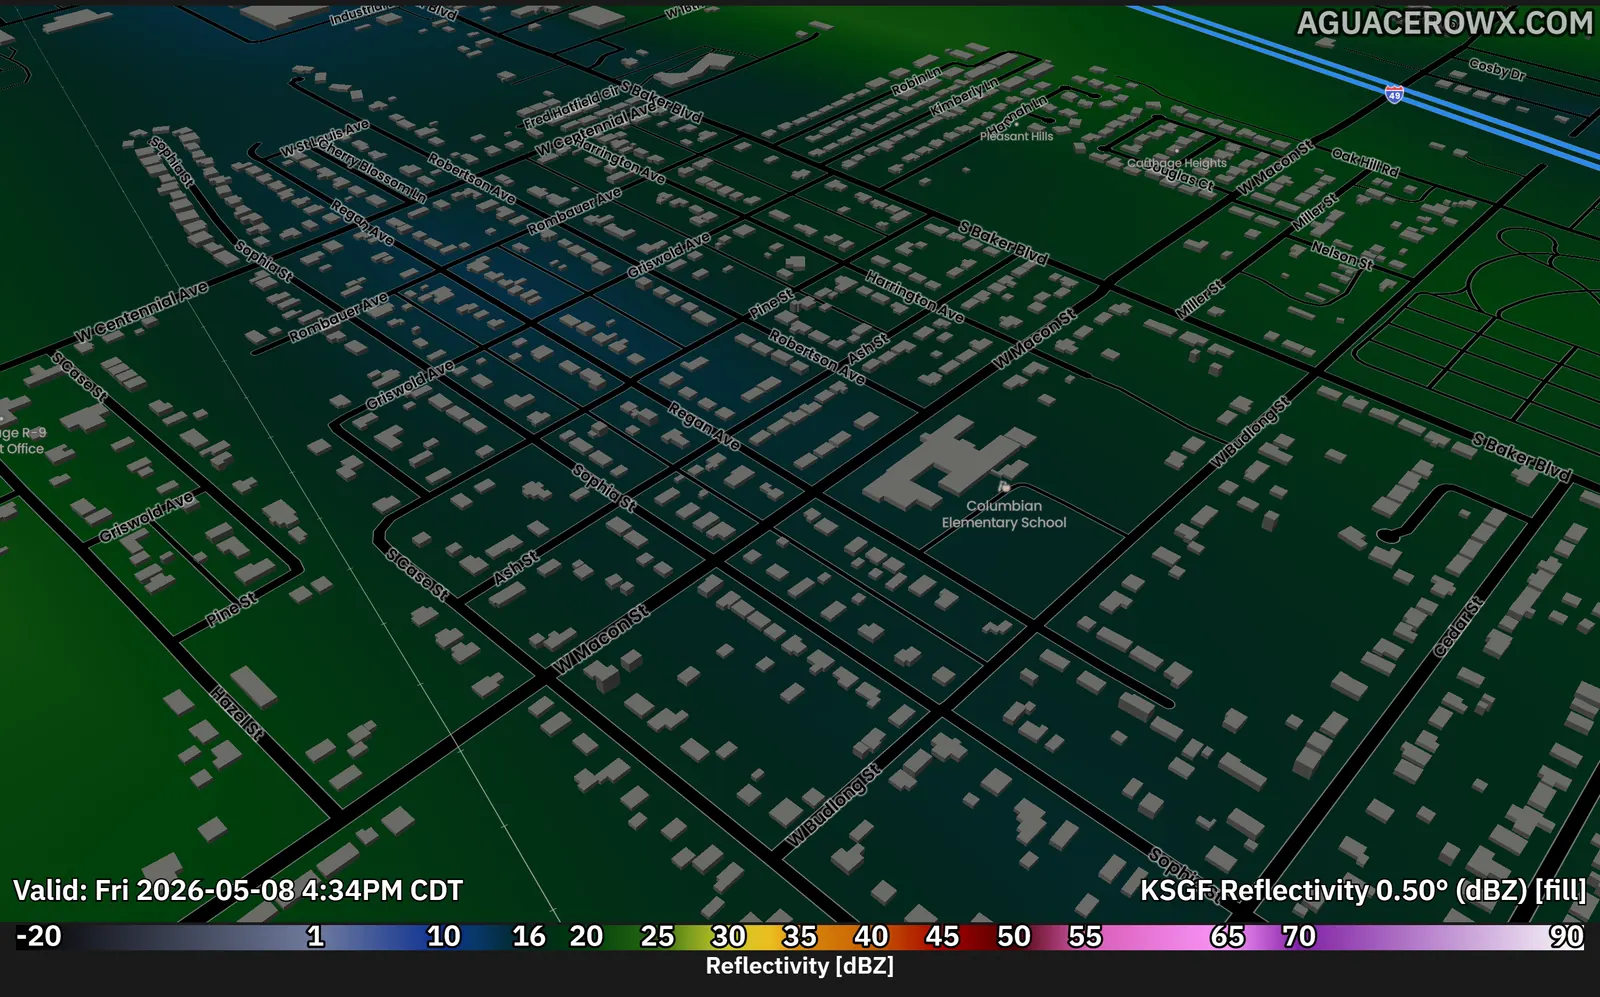
Streets, 3D buildings, terrain and hillshade, county names, lat/lon lines, day and night and zoom rules. Save 1 style on Free, unlimited from Enthusiast.
ToolbarHow to use
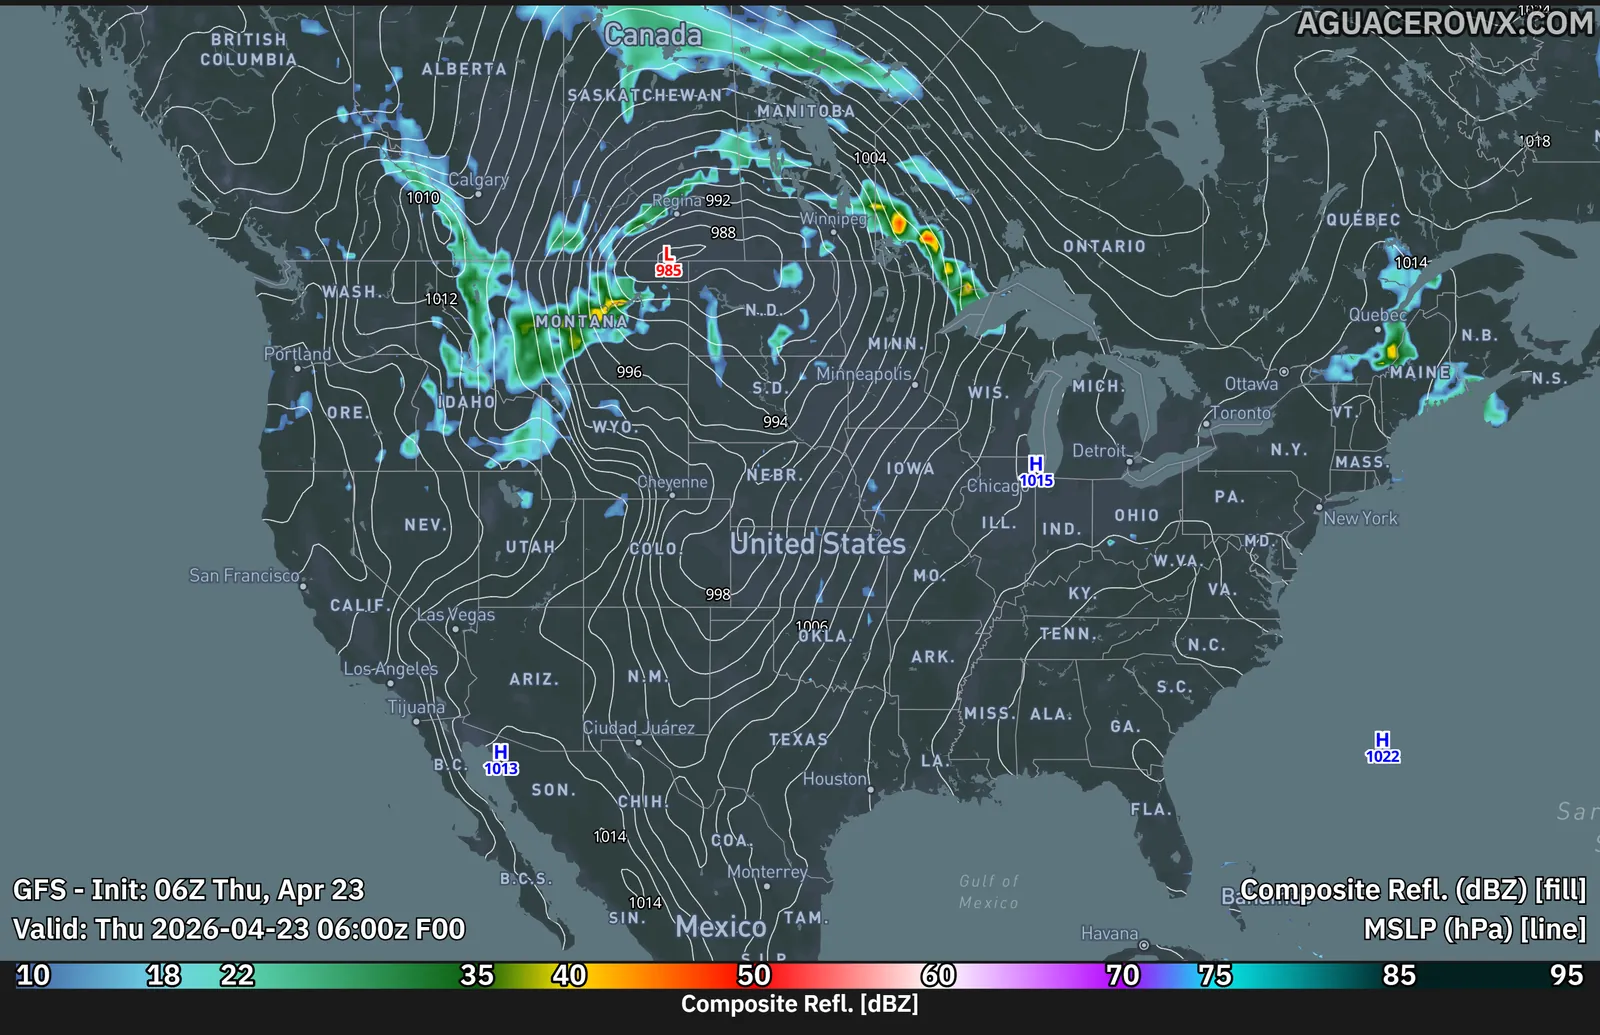
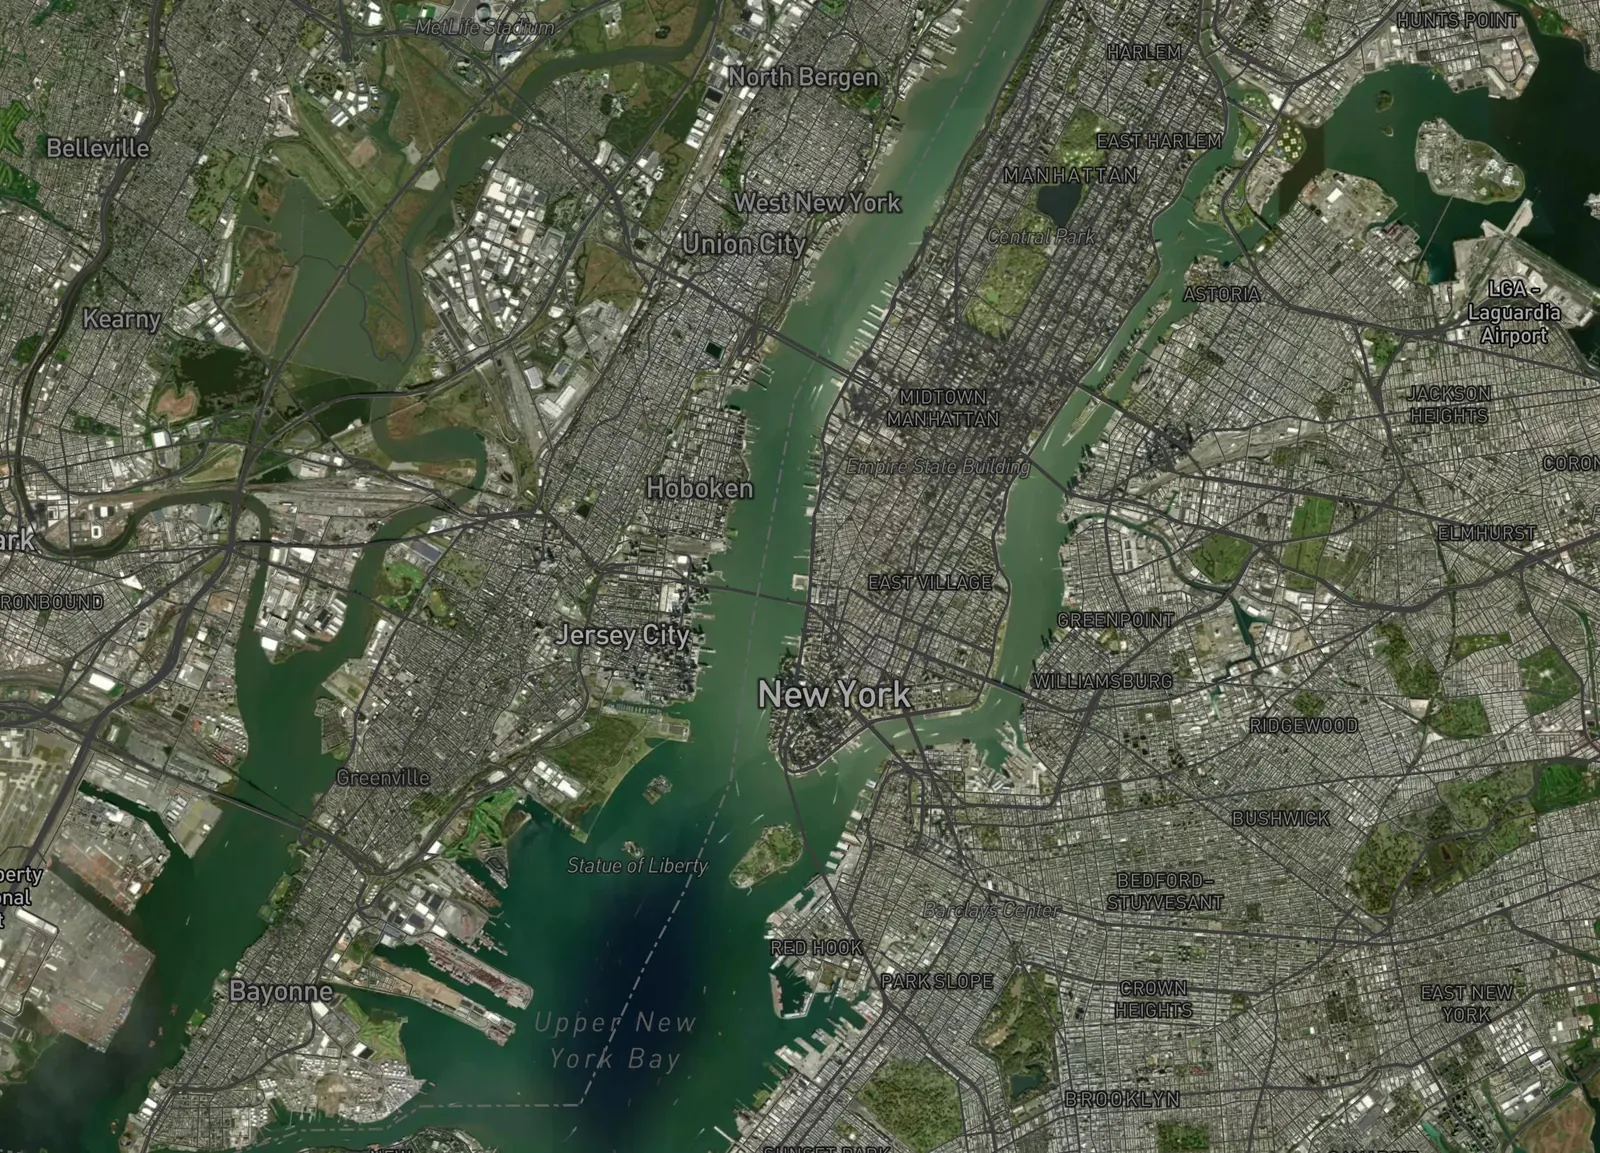
Imagery under your data, with saturation, contrast, shadow and highlight sliders.
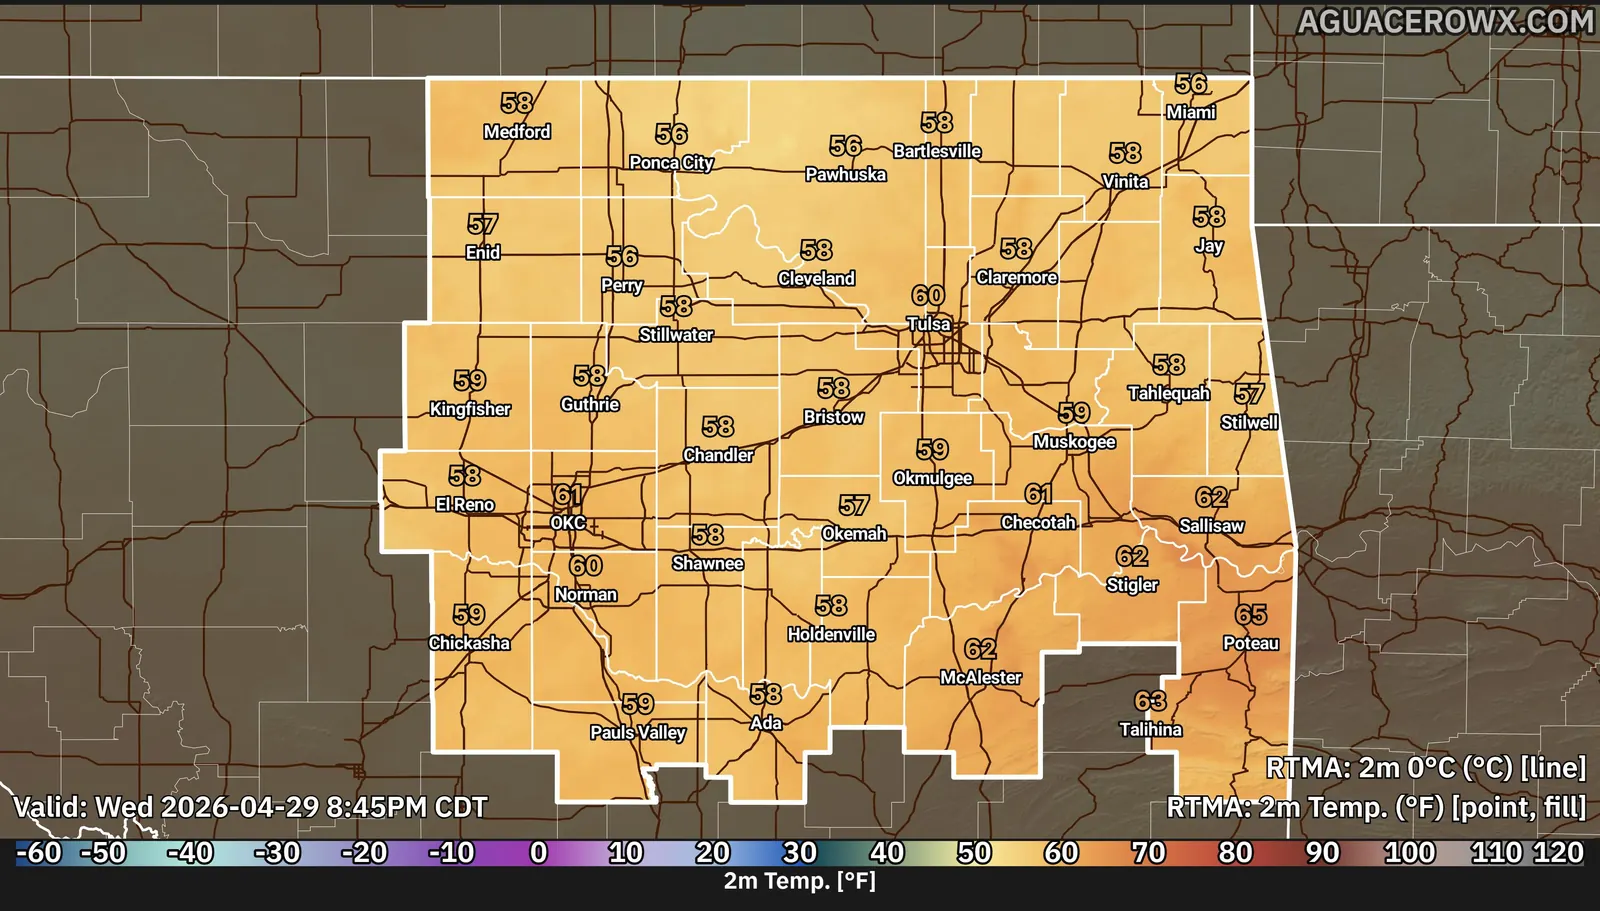
Highlight countries, states or counties anywhere, with drop shadows, and crop readouts and cities to the area.
ProfessionalHow to use
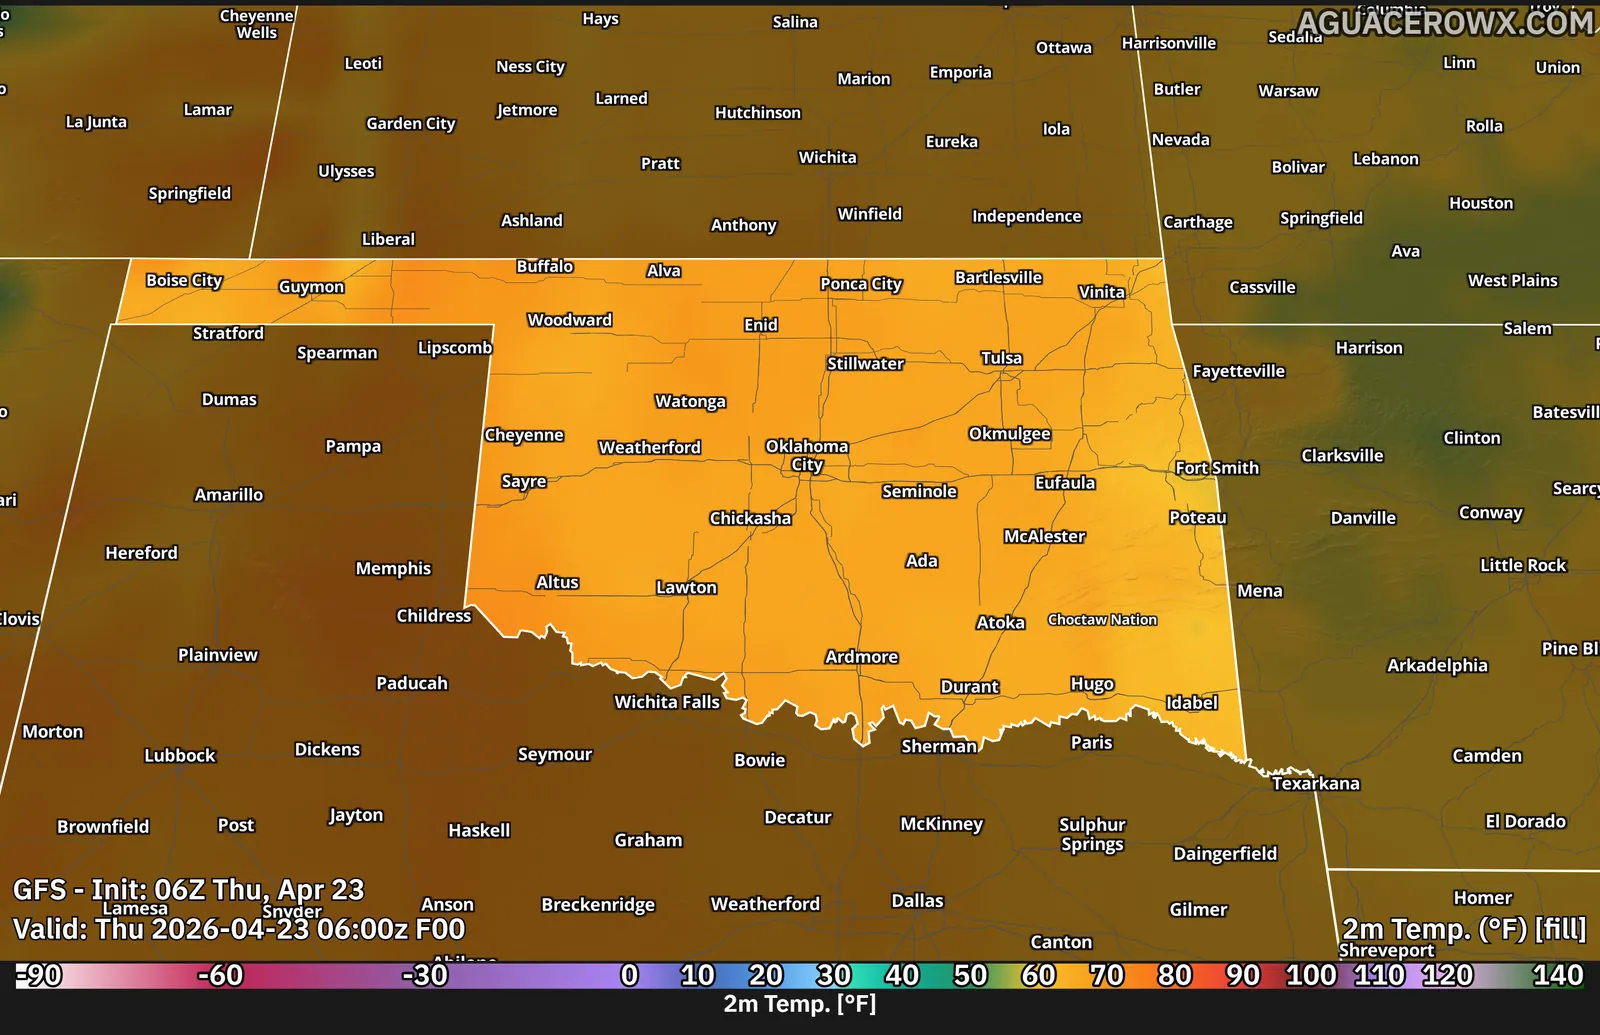
GeoJSON and shapefiles with your own colors, points and labels, loaded once or kept live from a URL.
ProfessionalHow to use
6 features
Draw forecasts, measure, follow your location and read values straight off the map.
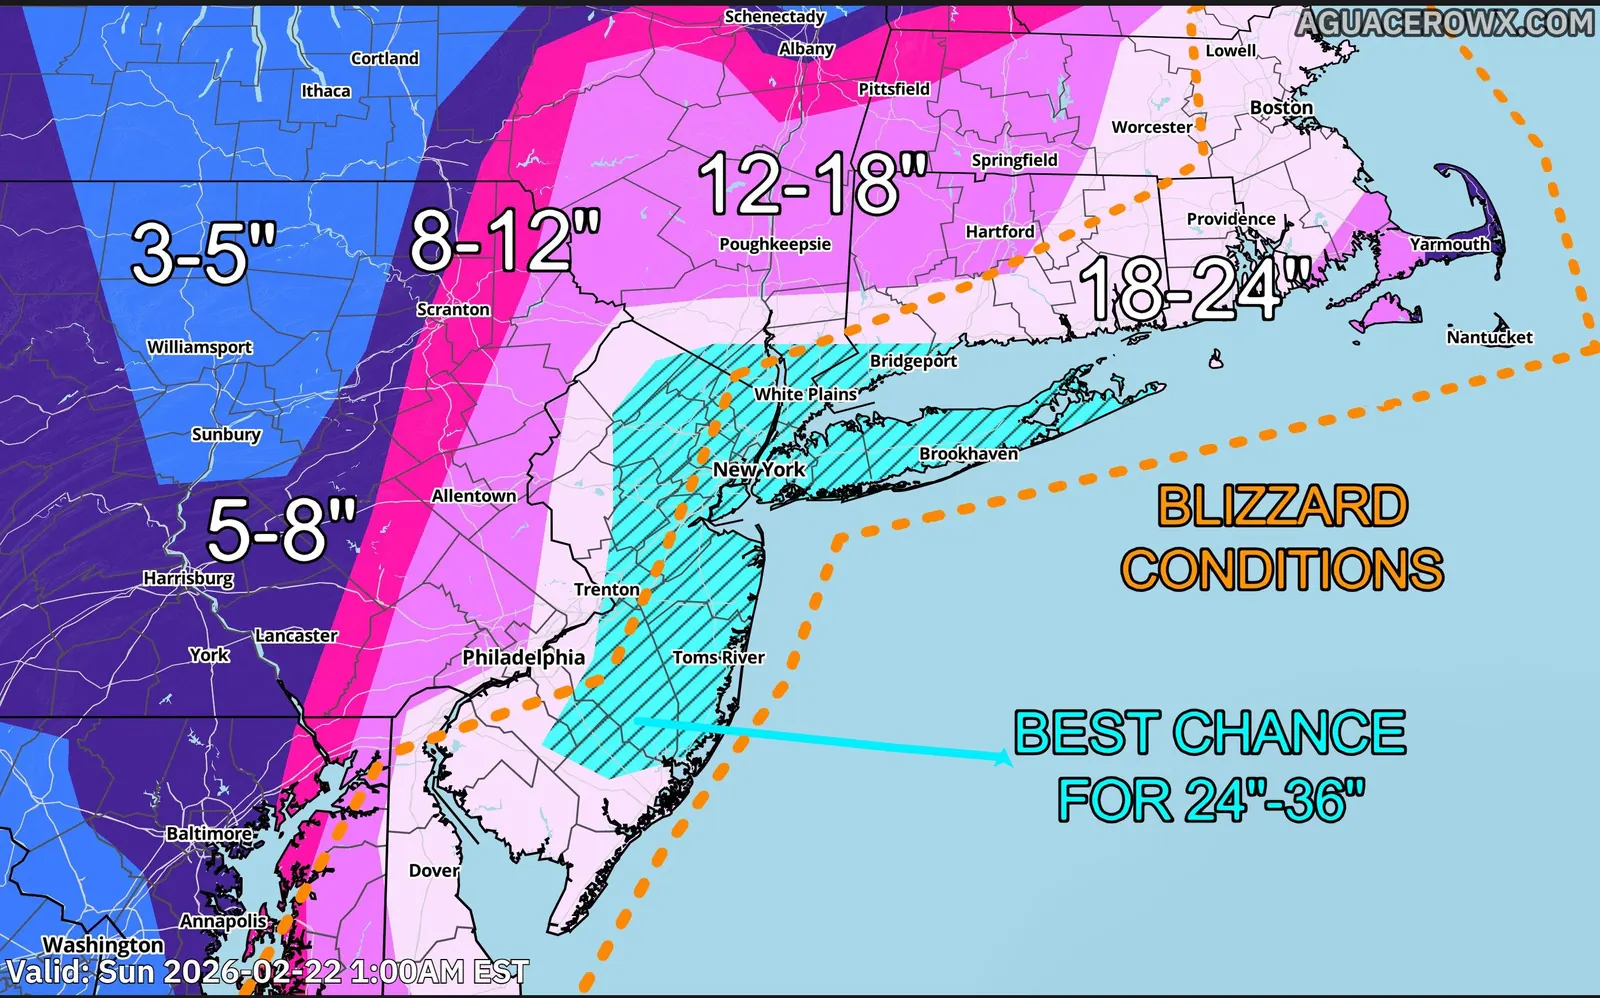
Draw forecast maps with polygons, hatching, fronts, highs and lows, storm icons and text, then save them as products.
ToolbarHow to use
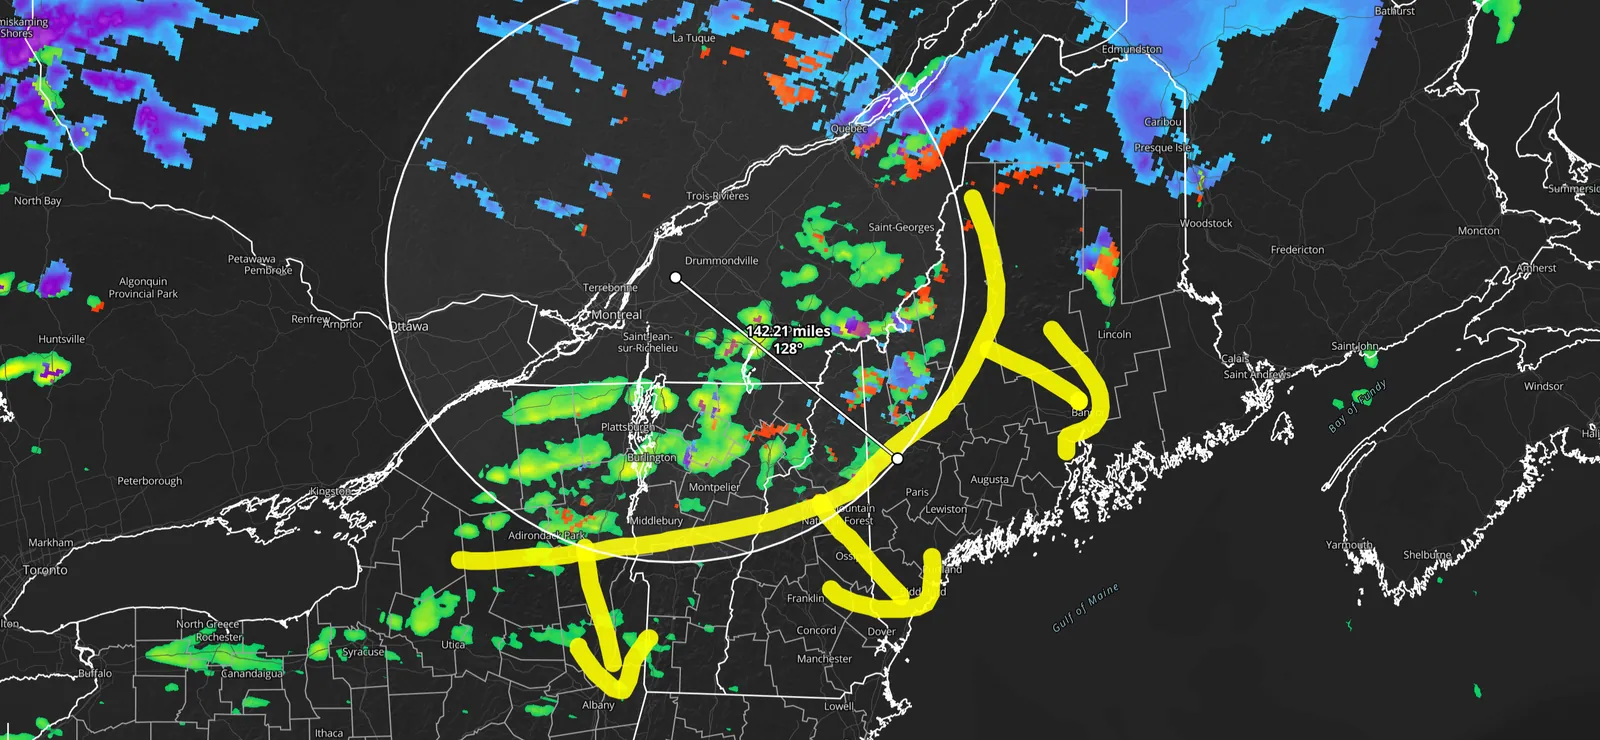
Draw freehand on the map with a pen and eraser to circle storms, sketch arrows or mark paths.
ToolbarHow to use
Measure distance and bearing, with range circles and your own units, colors and line styles.
ToolbarHow to use
Values under the cursor for every layer, with elevation. Pin one with a click combo (Alt+Shift+click by default).
ToolbarHow to use
Your own labeled points with icons and automatic readouts. Import them from JSON and save them in bundles.
ToolbarHow to use
Your position and heading on the map. The desktop app can also read a GPS receiver.
ToolbarHow to use
12 features
Creator tools that turn the workspace into on-air graphics, from headers and tickers to scenes.
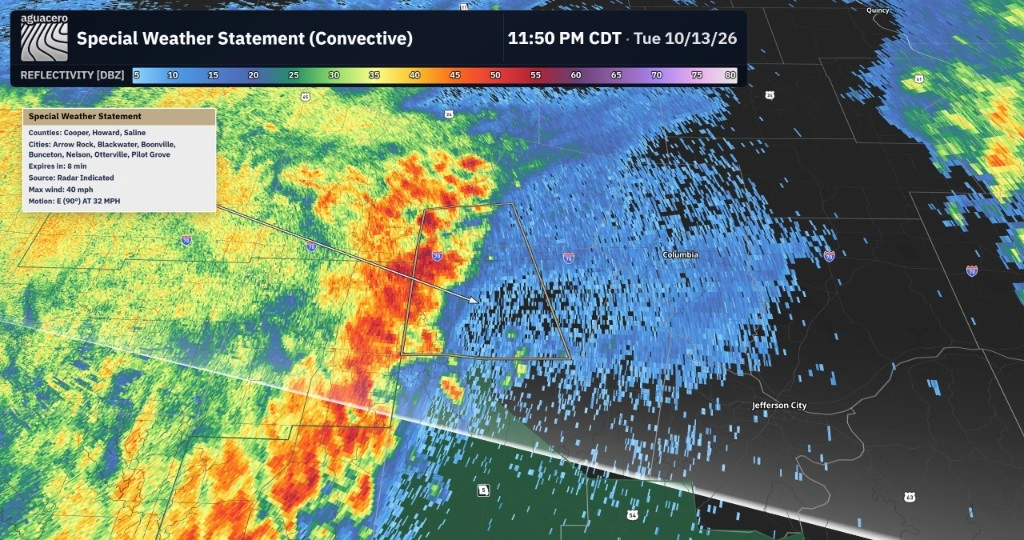
Turn the workspace into on-air graphics: a banner with your title, colors and fonts, your logo and the valid time. Save looks as presets.
CreatorHow to use
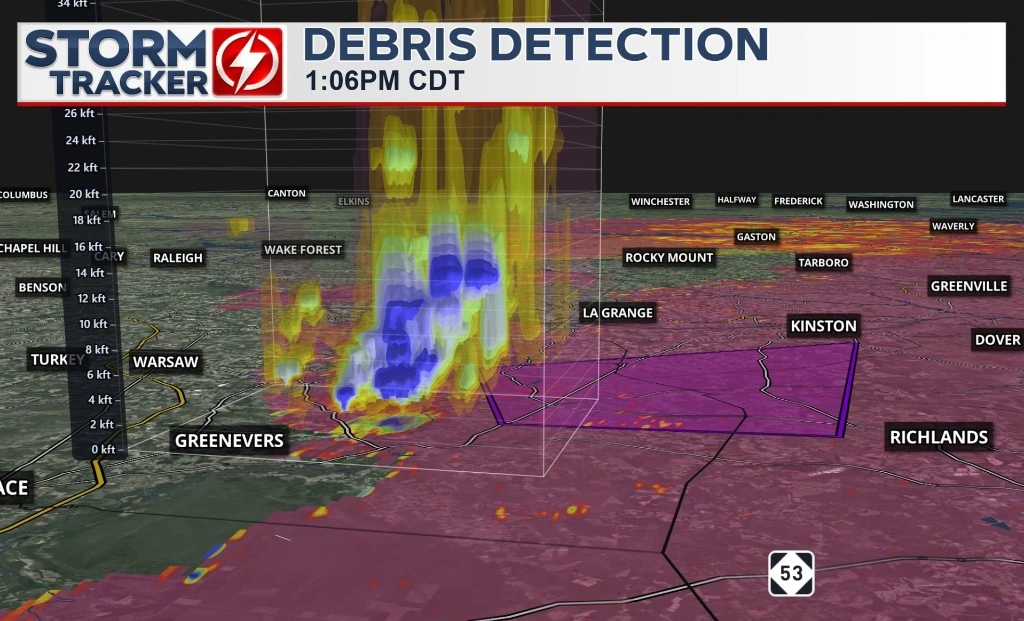
Import your own upper thirds and logos, stack several, animate them with WebM and add text boxes.
CreatorHow to use
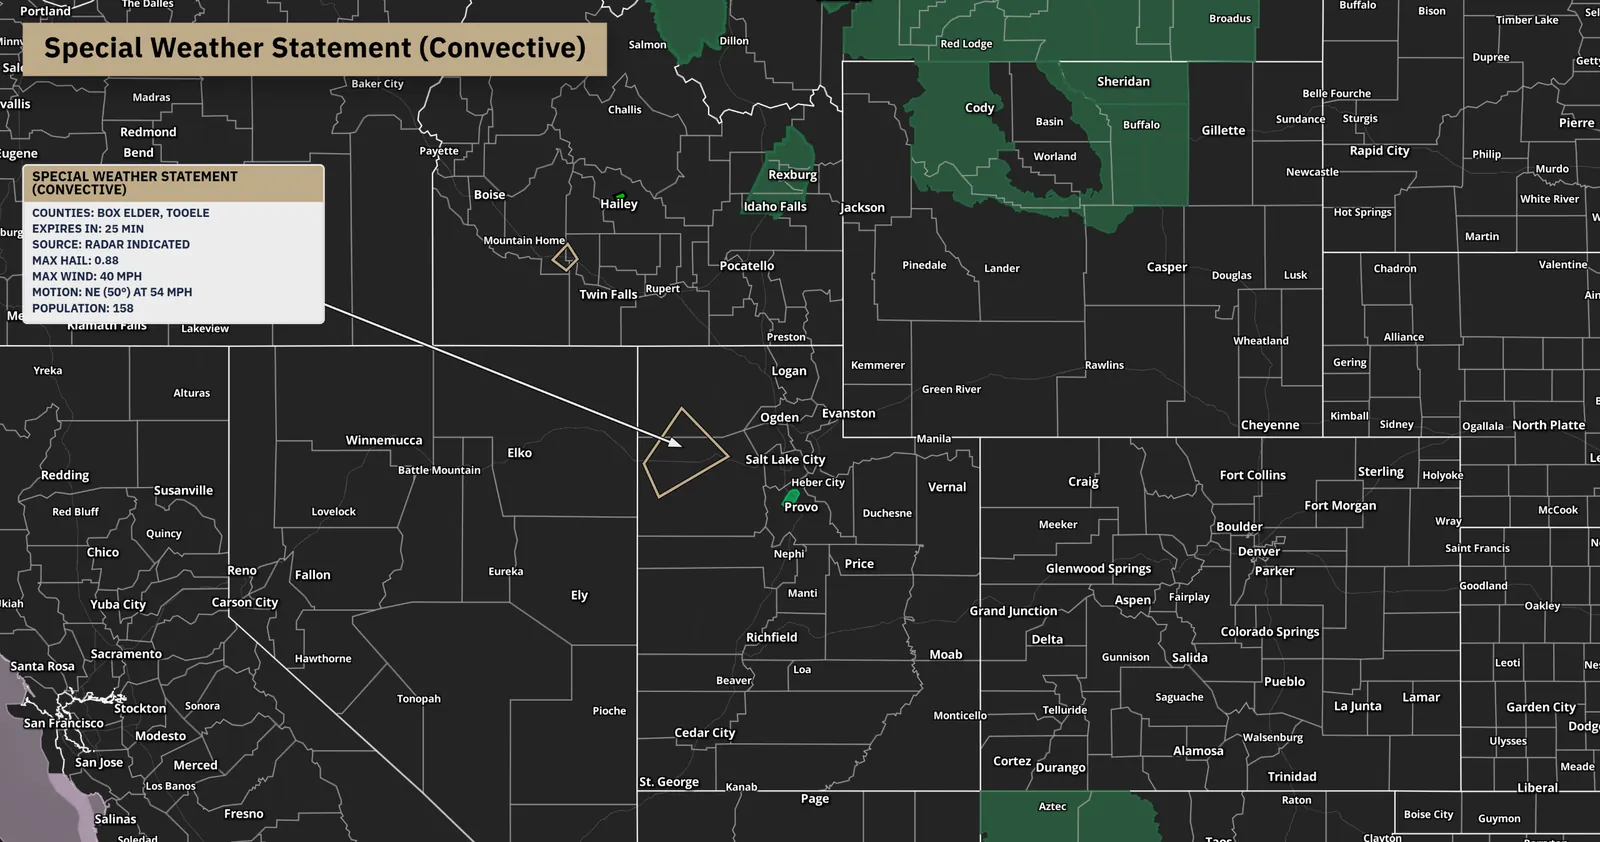
A TV-style title for the warning, cone or outlook you click, in the alert’s color, with an icon that stays readable.
CreatorHow to use
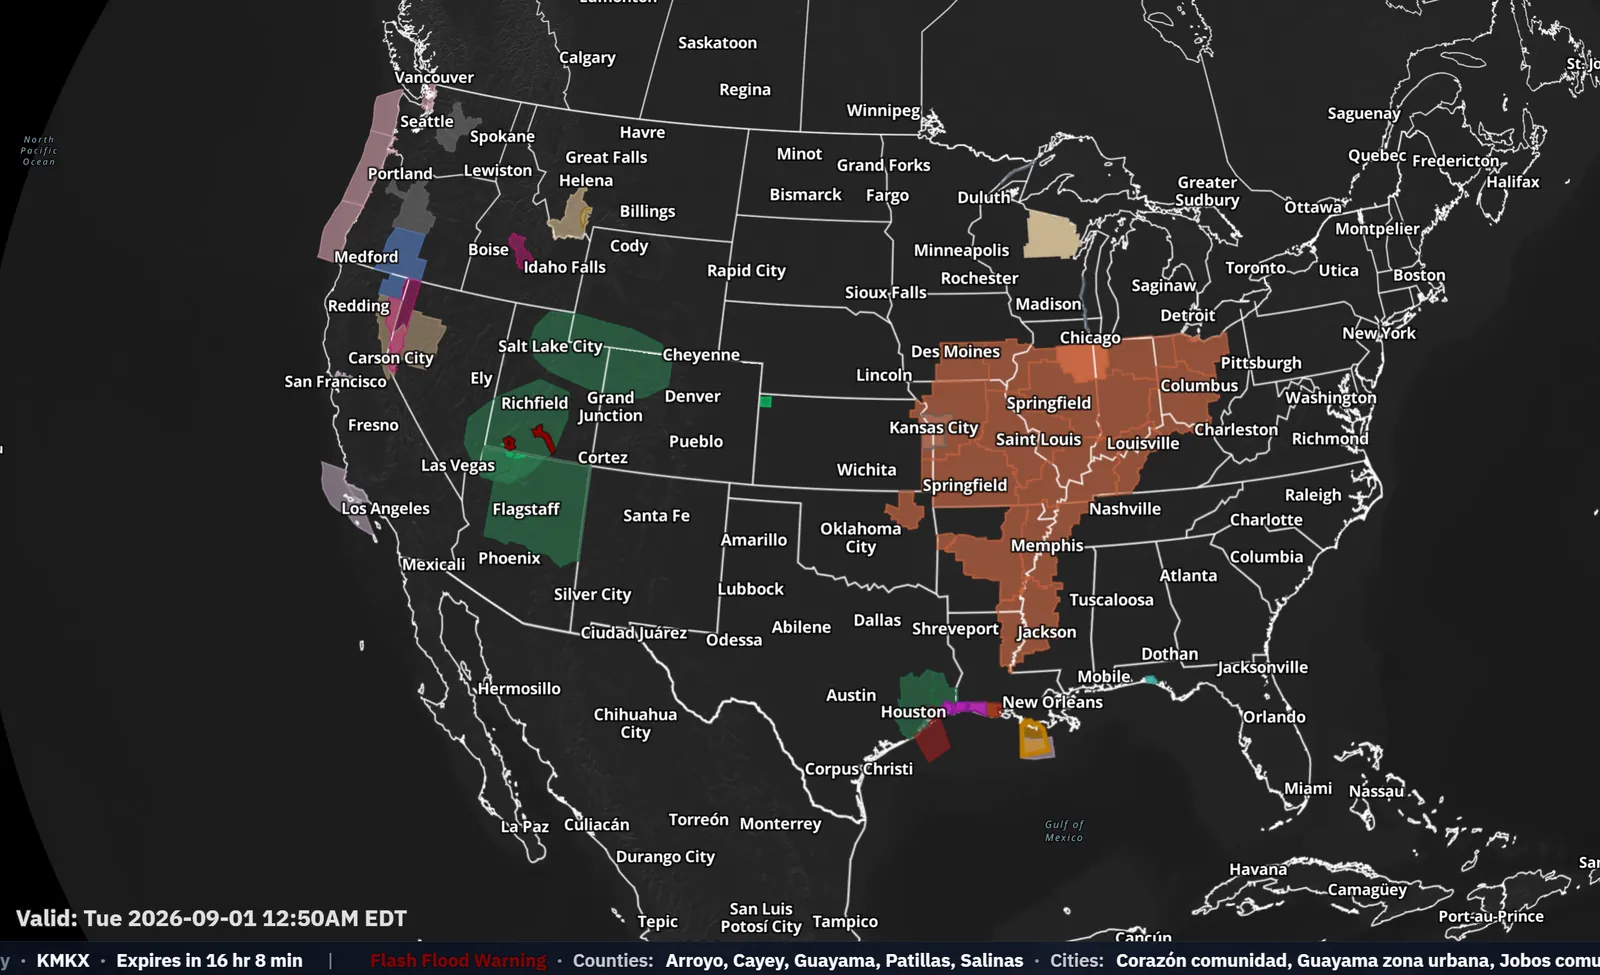
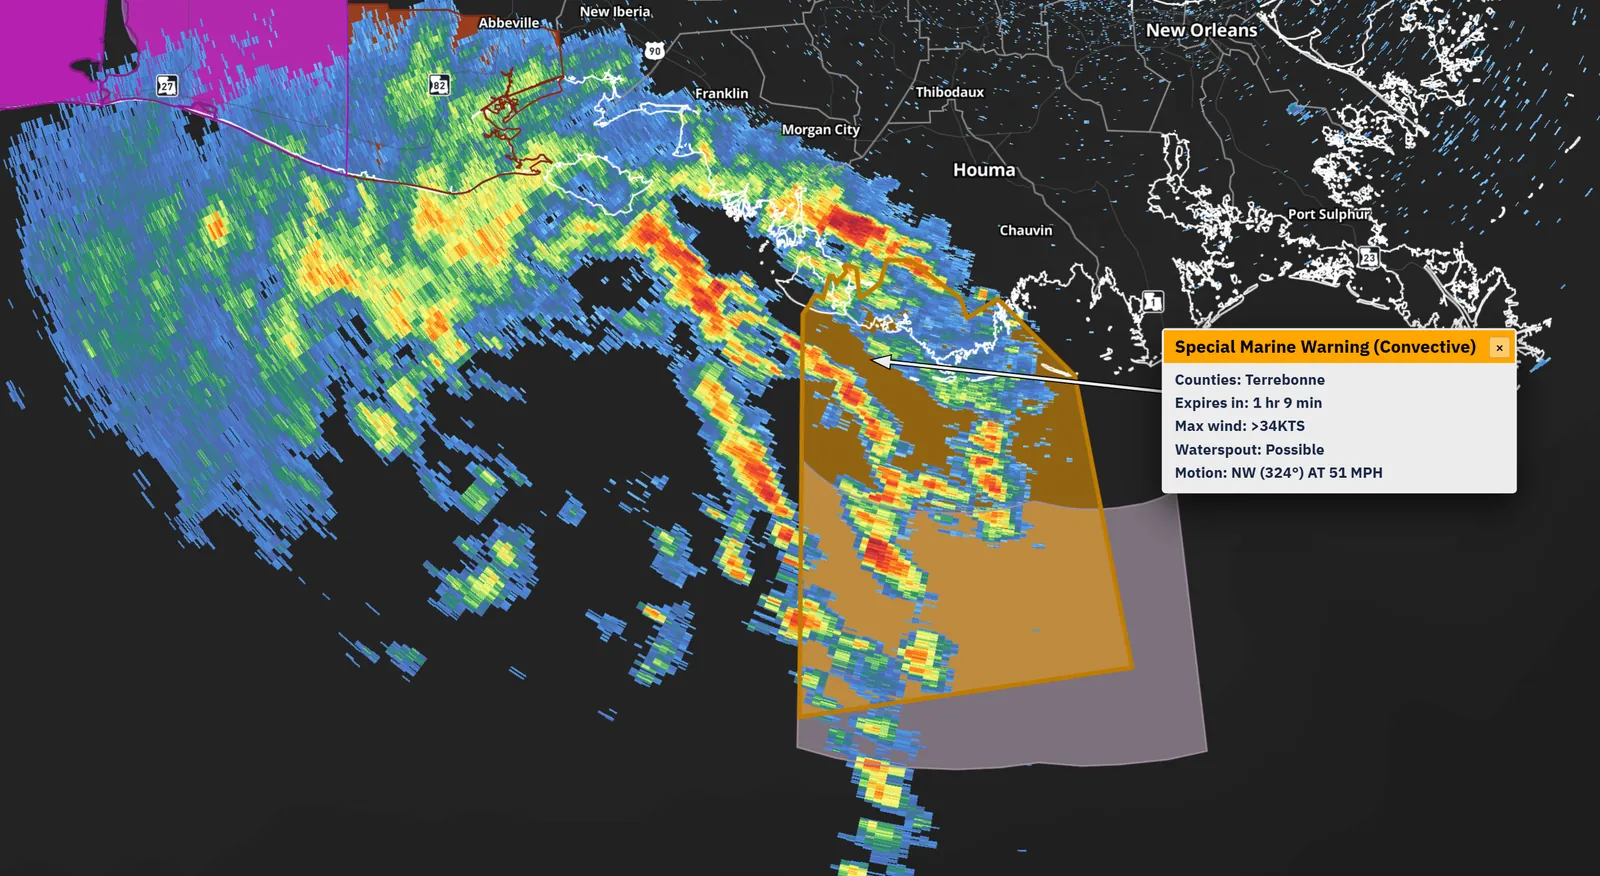
Broadcast-style popups for warnings and features. Show several at once.
CreatorHow to use
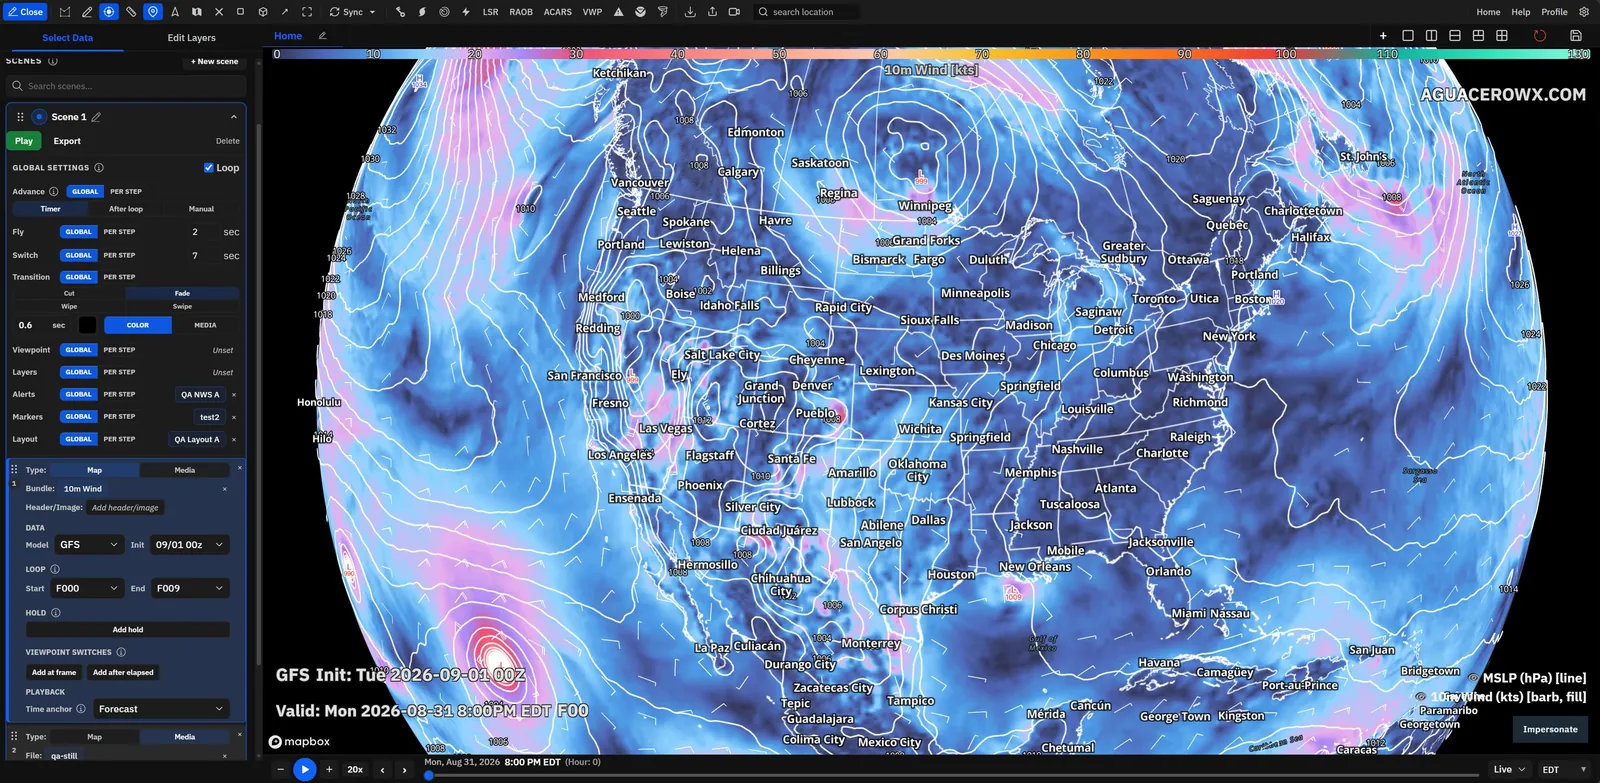
Step through bundles, viewpoints and media with transitions and holds, then export the whole scene to GIF or MP4.
CreatorHow to use
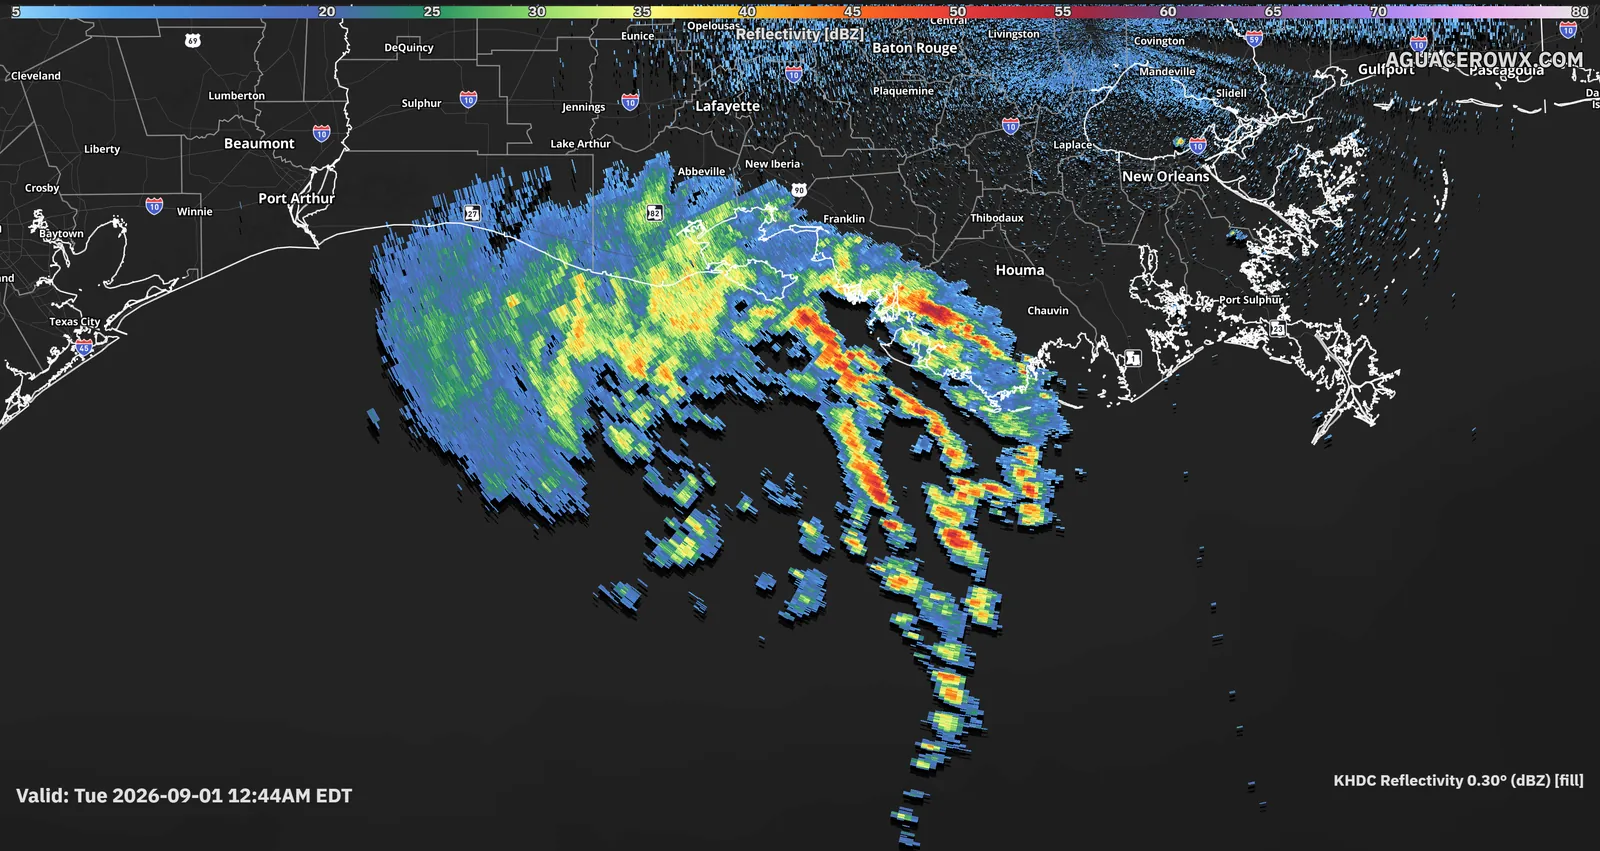
Save camera views to bundles and workflows, then play them back as a tour.
CreatorHow to use
Change how the text on the map looks: titles, legends, the valid time and more. Adding custom headers to a layout needs Creator.
A draggable toolbar that stays on the map, in place of the top toolbar.
CreatorHow to use
Lock the map to 16:9, 9:16 or another ratio, so screenshots and exports match your graphics.
New in 6.10How to use
4 features
Get maps, loops, charts and whole setups out of the app.
Save the board as an image, or send it through your device’s share sheet or to social platforms.
ToolbarHow to use
7 features
Use it in a browser or on the desktop, build on the same data with our APIs, and bring the whole team.
KML and KMZ weather layers for television graphics systems, quoted per station.
Runs in any modern browser. Desktop apps for Windows, macOS and Linux update themselves and use native compute for radar, contours and 3D.
Data as JSON, GeoJSON and NetCDF, saved bundles rendered to images and video, and our layers in your own Mapbox, MapLibre or React Native map. Each has a free monthly tier.
Commercial licenses cover every device your team uses, with one shared library of bundles and workflows.
CommercialHow to use
Customer locations and proprietary datasets as private layers, plus custom integrations.
CommercialHow to use
Professional and Creator features on every device for meteorology departments, at a discount.
Open AguaceroWx in your browser. The Free plan needs no card, and paid plans start with a 7-day free trial.