Mouse readouts
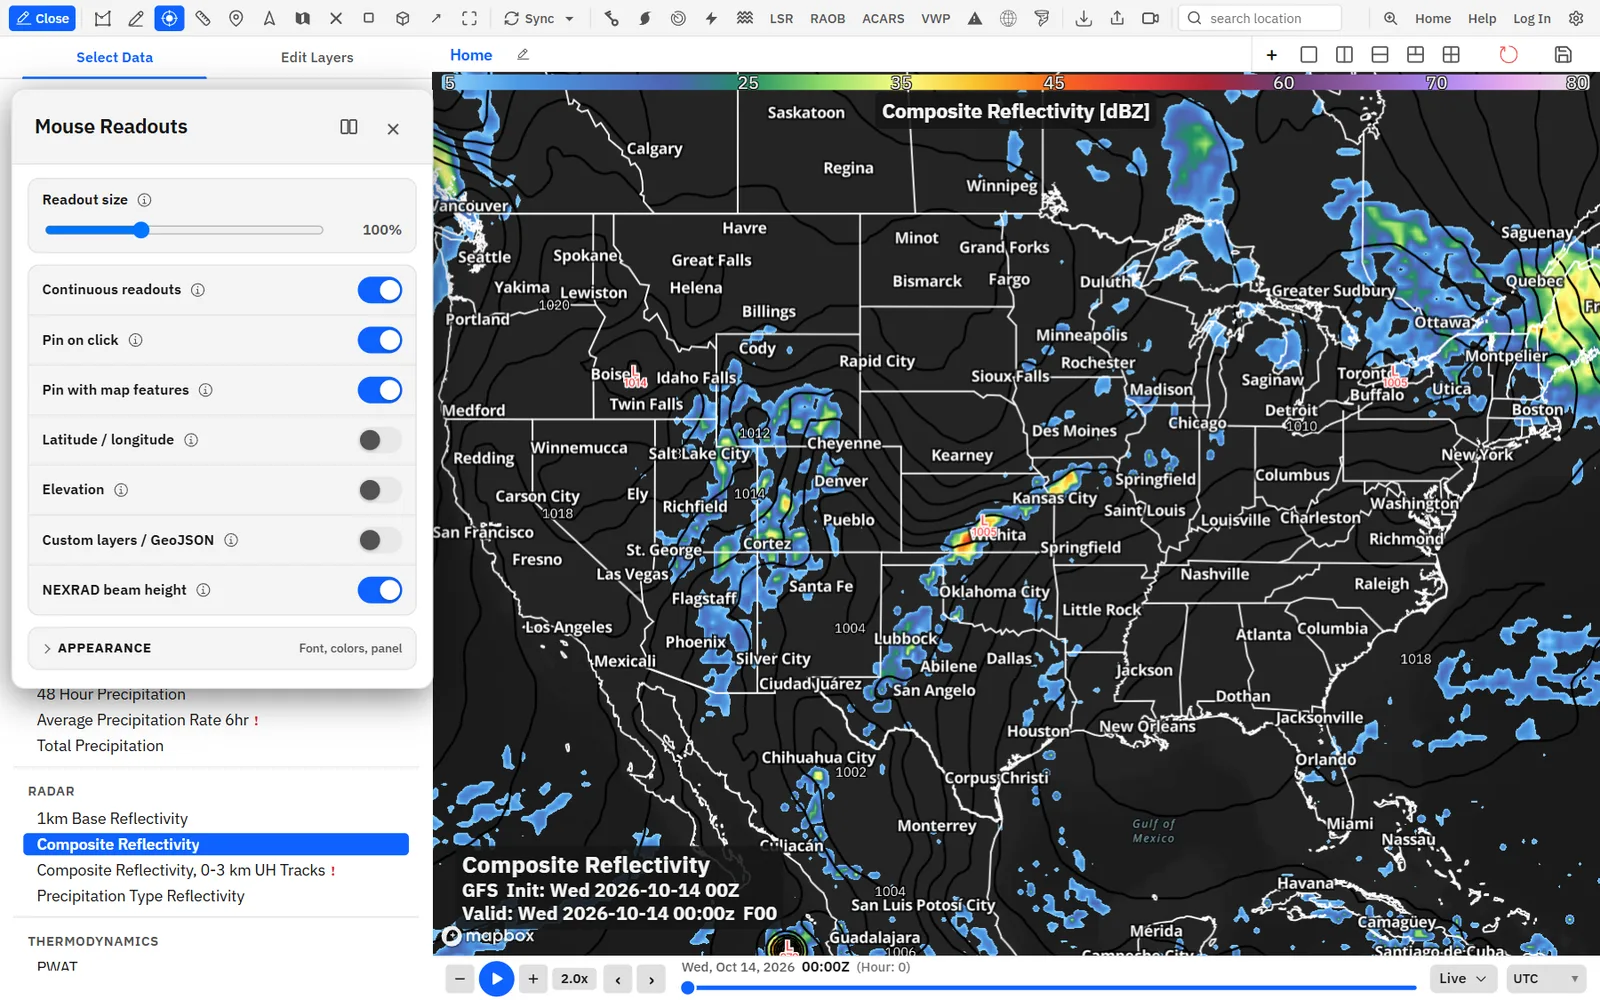
See the value of every layer under the cursor as you move the mouse, with coordinates and elevation if you want them. Pin a readout to keep it on the map.
Show me in the app- Single-click Mouse readouts on the toolbar to open its settings.
- Make sure Continuous readouts is on. Double-clicking the toolbar button also turns it on or off.
- Turn on any extras you want: Latitude / longitude, Elevation, NEXRAD beam height or Custom layers / GeoJSON.
- Move the cursor over the map. The readout lists each layer’s value at that point.
- Click the map to pin the readout there as a popup.
Tips
- To pin only when you mean to, turn Pin on click off and use Alt + Shift + click instead. That combo pins even on warnings and other map features.
- Open Appearance in the same settings to change the readout font, colors and panel, and use Readout size to scale it.
Shortcuts
- Alt + Shift + click
- Pin a mouse readout
- Backspace
- Remove the most recent pinned readout on the active panel
- Shift + Backspace
- Clear every pinned readout on the active panel
Ruler
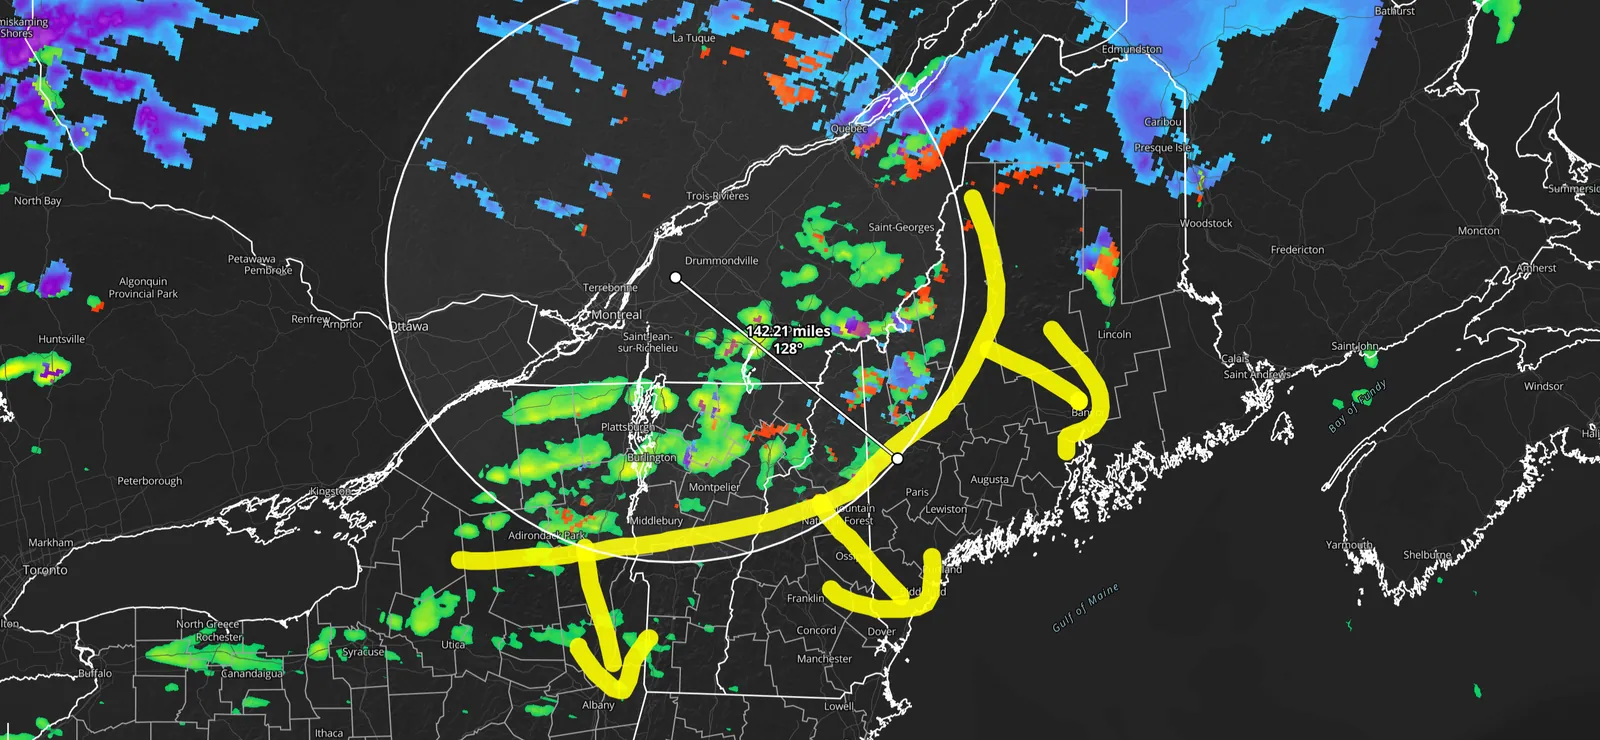
Measure the distance and bearing between two points on the map, with a range circle around the start point.
Show me in the app- Double-click Ruler on the toolbar. The cursor turns into a crosshair.
- Press on the map at the start point and drag to the end point.
- Release. The line stays on the map with its distance and bearing, and a range circle shows that distance around the start point.
- Drag again to measure something else. The previous line clears.
- Double-click Ruler again to stop measuring.
Tips
- Single-click Ruler to open its settings. Units offers Match app units, Miles, Kilometers and Nautical miles.
- In the same settings you can change the Line style, Line color and Line width, and turn Range circle, Endpoint dots and Show bearing on or off.
Drawing
Draw freehand on the map to circle a storm, sketch an arrow or mark a path, then erase or undo as you go.
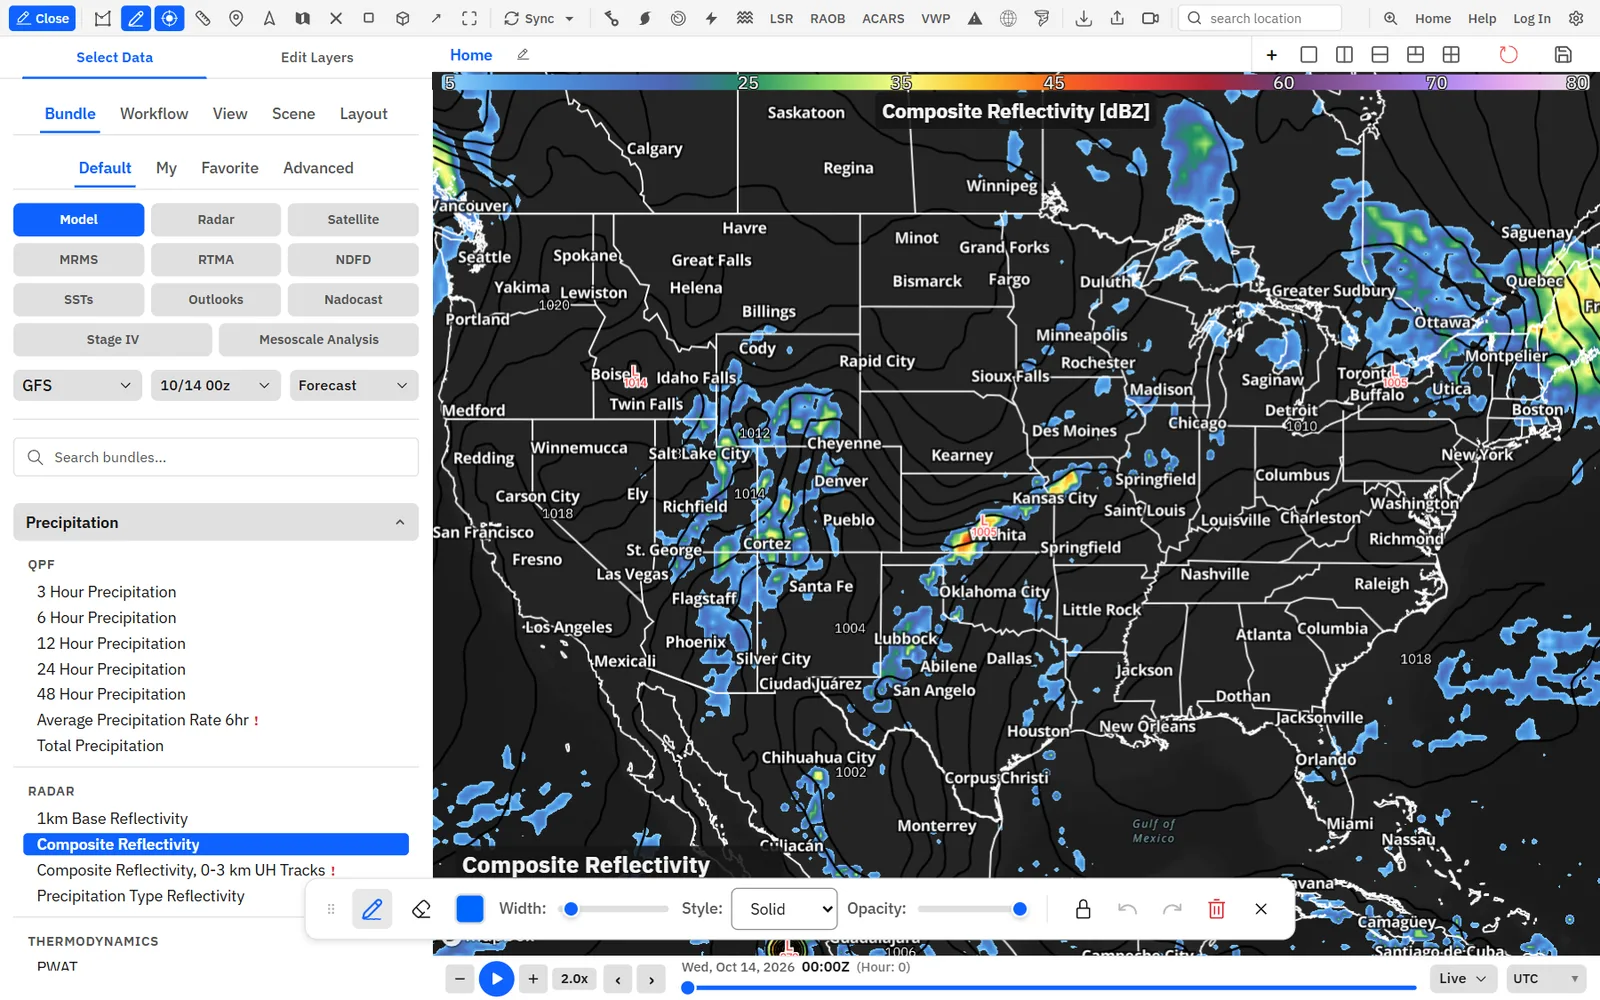
Show me in the app- Click Drawing on the toolbar. The drawing toolbar appears over the map.
- Choose Pen, pick a color, then set Width, Style (Solid, Dashed or Dotted) and Opacity.
- Press and drag on the map to draw.
- To fix a mistake, choose Eraser and drag over the line, or click Undo and Redo.
- Click the lock button to switch between drawing (Lock to Draw) and moving the map (Unlock to Pan Map).
- Click Clear All to remove every drawing, or Close Drawing to put the tool away.
Tips
- Drag the grip on the left edge of the drawing toolbar to move it out of the way.
PGEN forecast maps
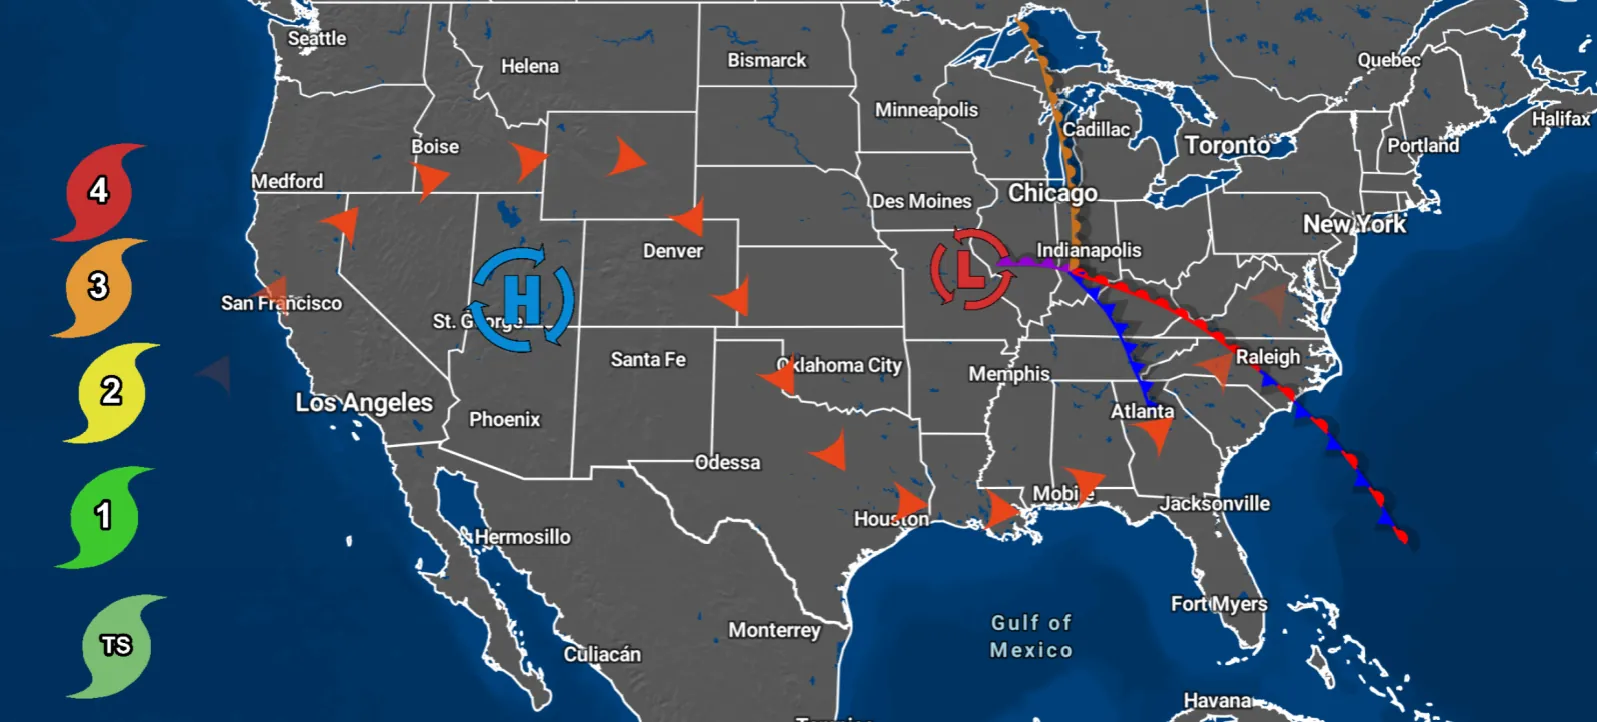
PGEN (Product Generation) draws formal forecast graphics: fronts, highs and lows, hatched areas, storm icons, shapes and text. Save each map as a product and load it again later.
Show me in the app- Click PGEN on the toolbar. The Drawing Tools window opens on the Draw tab.
- Pick a tool. Line, Pen, Arrow and the Fronts tools draw paths. Text, High (H), Low (L), Hurricane, Fire and Rotating Storm place a symbol. Shapes draw a rectangle, circle, ellipse or triangle.
- For a path, click points along it on the map, then double-click or press Enter to finish. With Pen, click the first point again to close the area.
- For a symbol or text, click the map where it goes. For a shape, drag on the map.
- Click a feature on the map or in the Layers list, then use the Style tab to change its colors, line, fill, Hatch Pattern and shadow.
- Type a Product Name and click Save New. After later changes, click Update.
- Open the Products tab to load or delete a saved product.
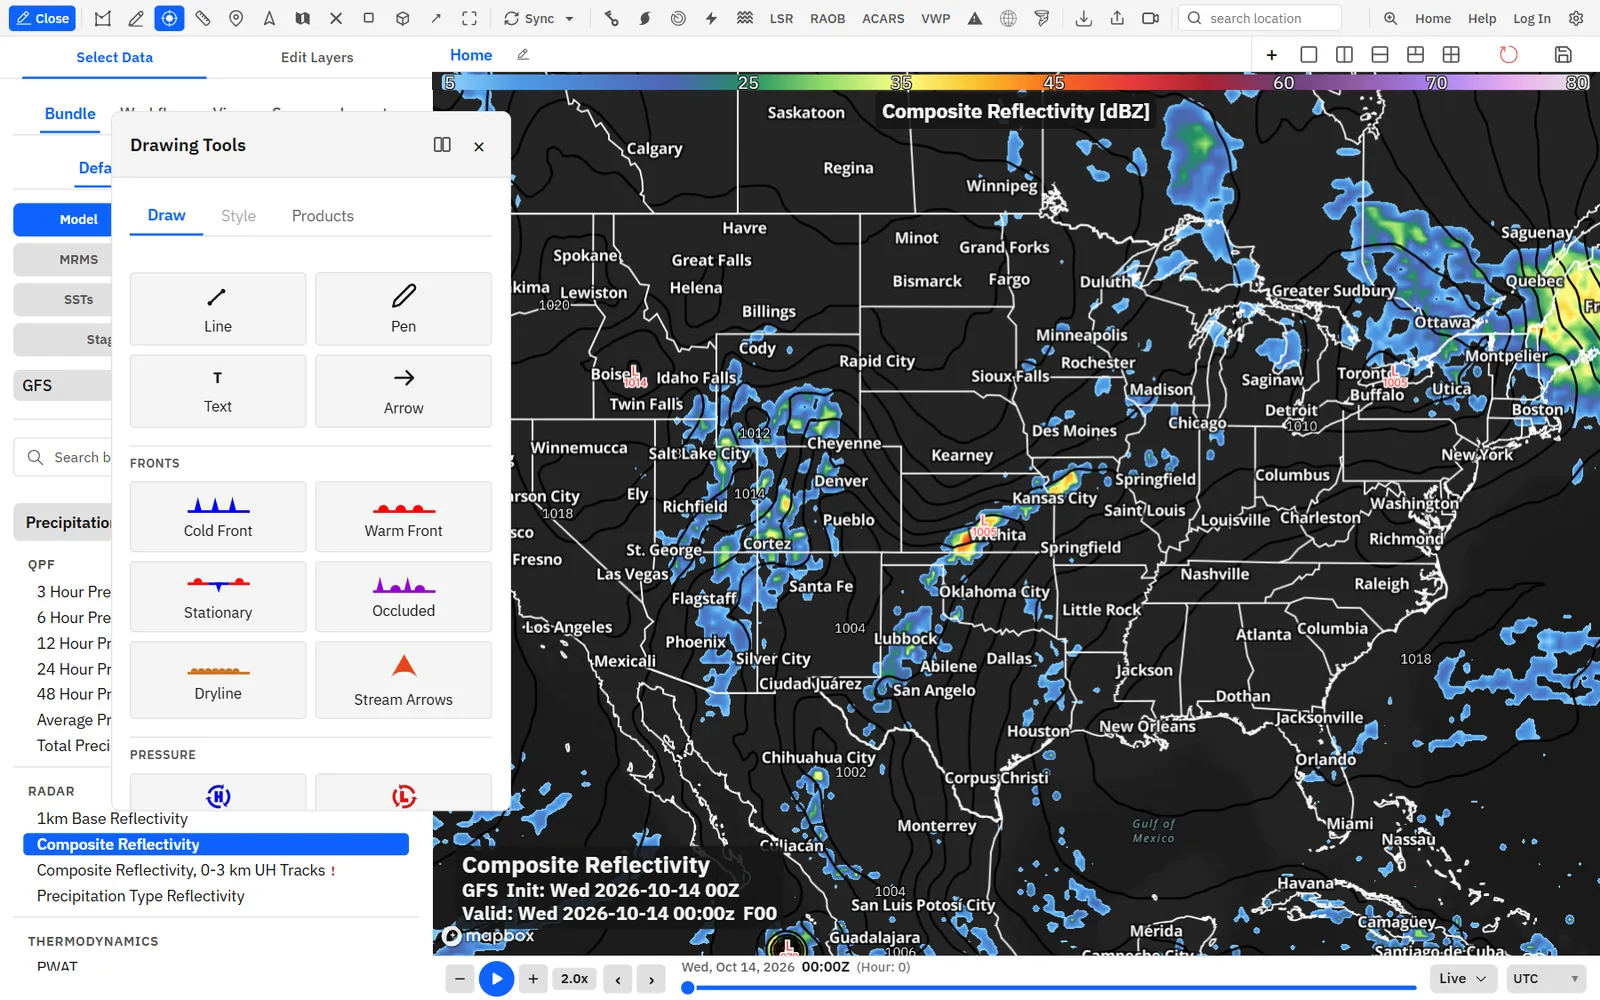
Tips
- Double-click text on the map to edit it. Drag a corner to resize it.
- Under Layer Position, turn on Fills above other layers or Fills behind water to change where filled areas draw.
- Use the arrows in the Layers list to change the drawing order. Clear All removes everything on the map.
Shortcuts
- Enter
- Finish the line, front or area you are drawing
- Backspace
- Remove the last point while drawing
- Esc
- Cancel the line or shape you are drawing
- Delete
- Delete the selected feature
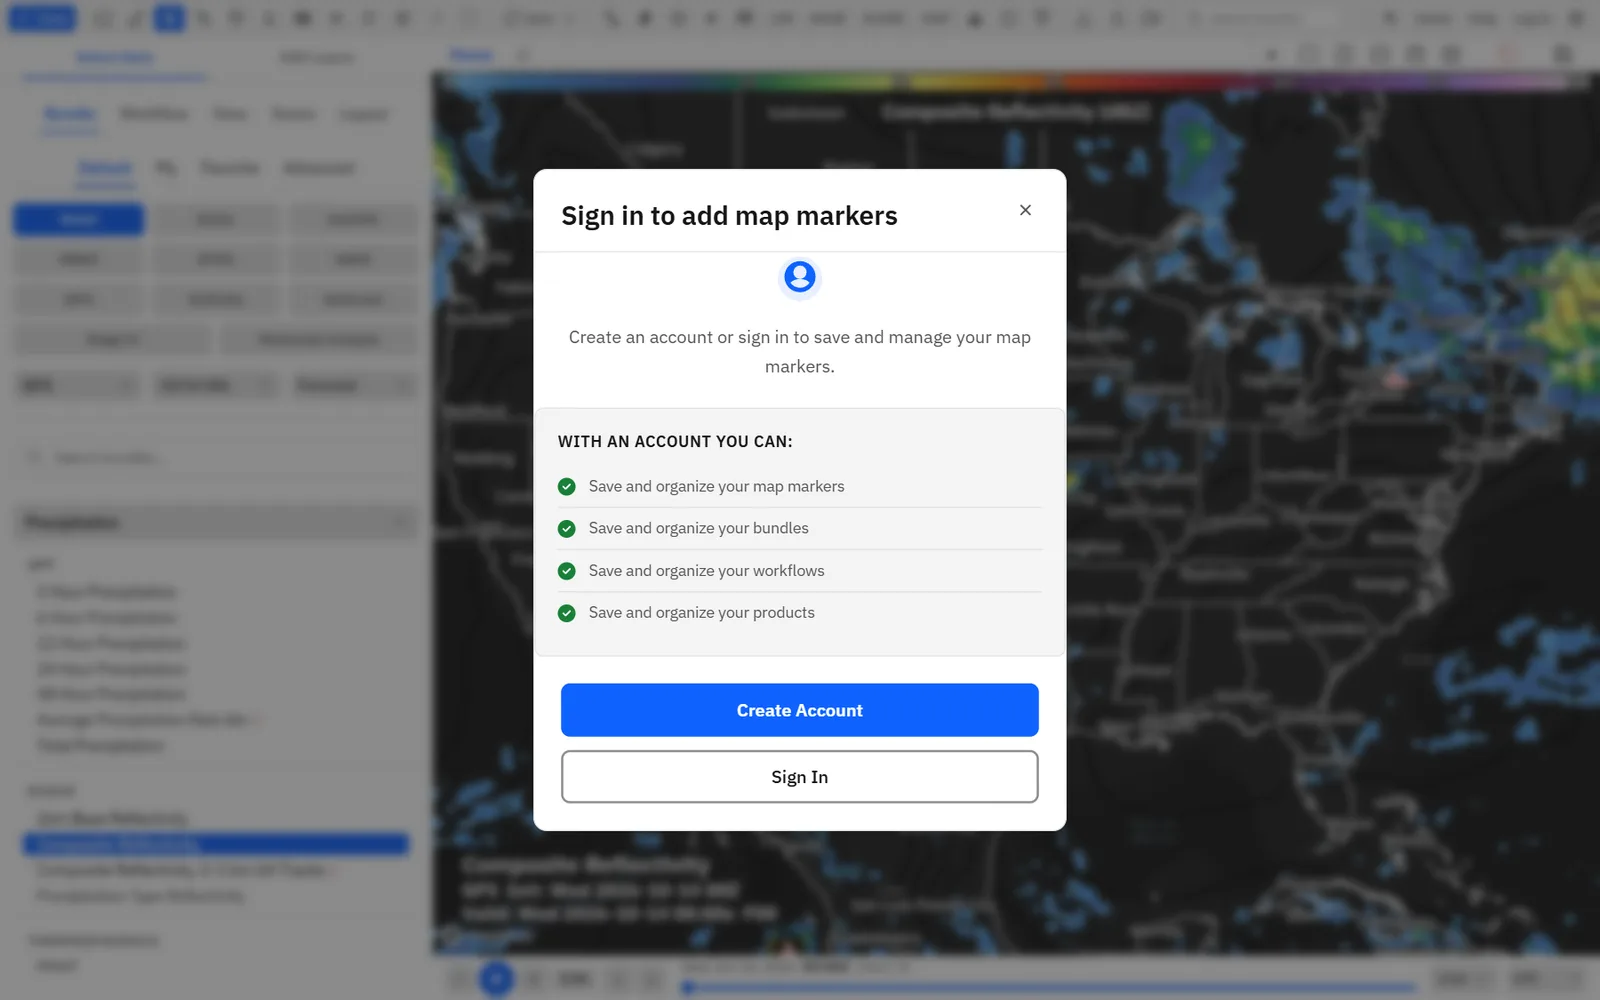
Saving products needs a signed-in account. Uploading your own images under Images needs Professional or above.
Name markers
Add your own labeled places to the map, such as your town, a chase target or client sites, with icons and live data readouts.
Show me in the app- Single-click Name markers on the toolbar to open Manage Name Markers.
- Turn on Enable Name Markers.
- Click + Add Marker and type a name.
- Under Location, search for an address or enter coordinates such as 40.7128, -74.0060.
- Pick an icon, then click Add Marker.
- Open the Appearance tab to set the font, colors and icon size, and turn on Show data readouts at markers.
To add many places at once, click Import and choose a JSON file. Each entry needs a name, lat and lon (latitude and longitude also work), and icon is optional. A GeoJSON file of points works too. Then choose Add to list or Replace all. Export saves your list as a JSON file.
Tips
- Double-click Name markers on the toolbar to show or hide all your markers.
- On the Bundles tab, name a preset and click Save current to keep this marker list and its look. Click a preset’s name to switch back to it.
- When you save a bundle or workflow, turn on Save name markers to bundle (or Save name markers to this workflow) to keep markers with it.
My location
Show your position and the direction you are facing on the map, and keep the map centered on you while you move.
Show me in the app- Double-click My location on the toolbar to turn your location on.
- Allow location access when your browser or computer asks.
- Single-click My location to open its settings.
- Turn on Follow location to keep the active map centered on you, or click Recenter map to jump back once.
- On a phone or tablet, click Enable compass so the marker shows which way you face.
- Change the marker under Marker style, Facing direction and Accuracy ring.
In the desktop app, GPS source can read a USB or Bluetooth GPS receiver. Auto (GPS puck, then system) uses the receiver when one is connected. To share one receiver with other programs, run a GPS splitter and choose its virtual serial port (Other serial port…) or its network feed (Network: TCP… or Network: UDP…).
Laptops usually have no GPS of their own, so without a receiver your position comes from Wi-Fi or the system. High-accuracy GPS asks for a more precise fix but does not add a receiver.