Open a layer’s style settings
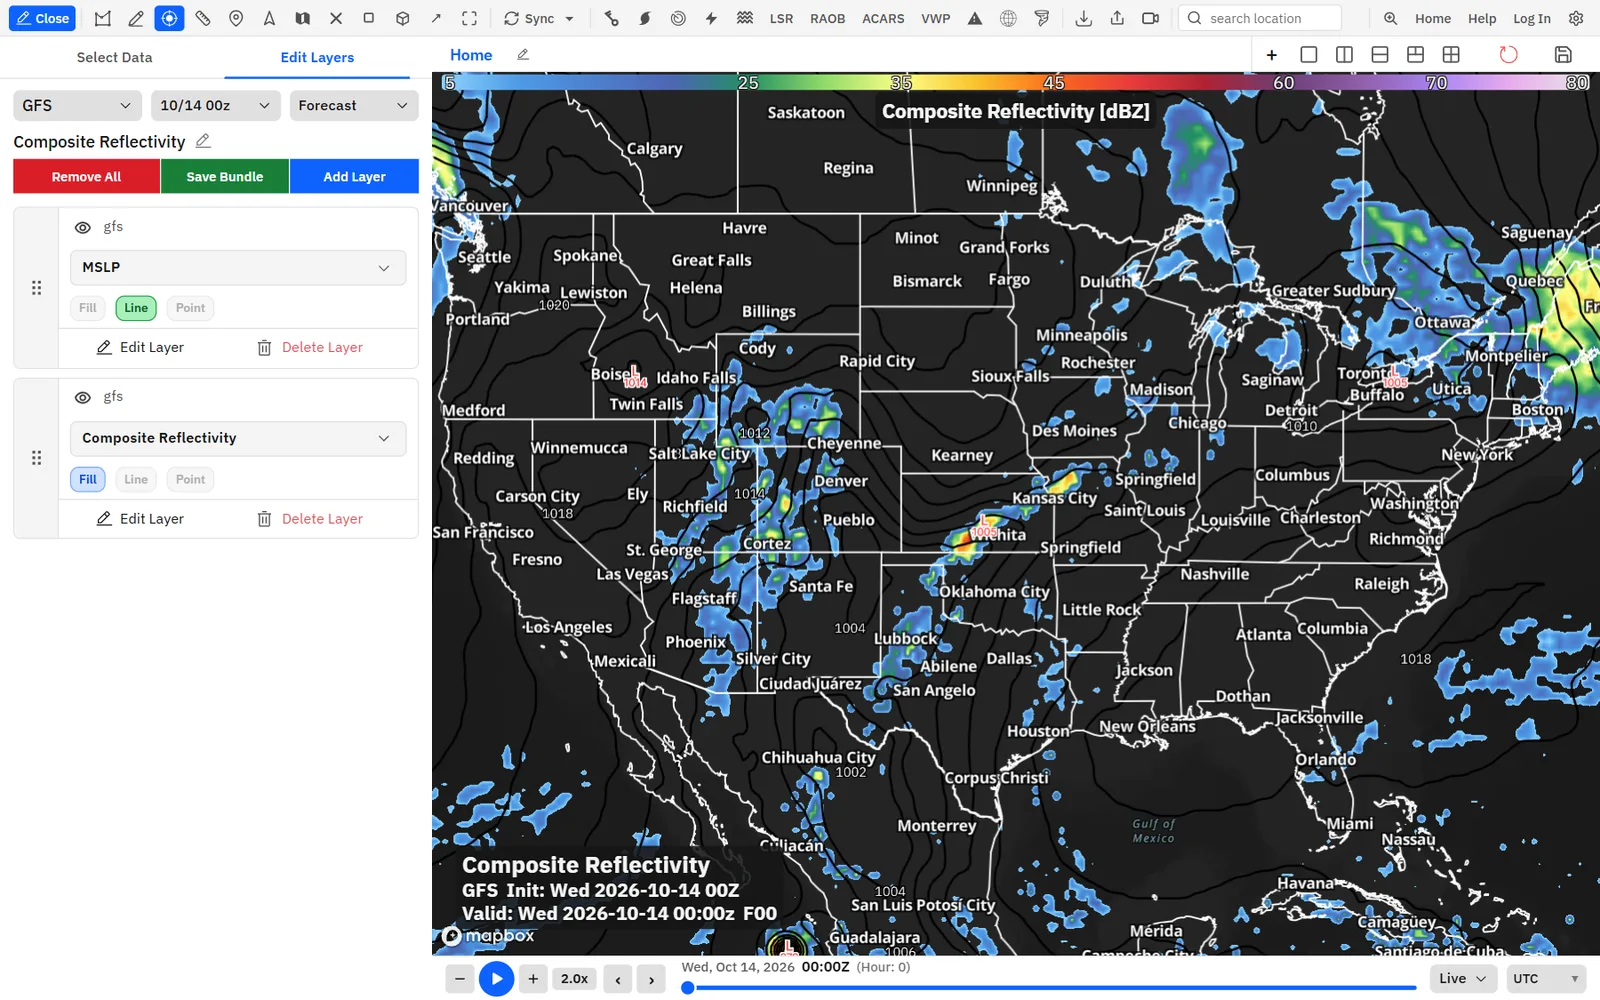
Each layer can draw as a fill, lines, point values or wind symbols. You turn each one on and style it from the layer’s Edit Layer panel.
- In the sidebar, click Edit Layers.
- On a layer row, click the Fill, Line, Point, Barb or Vector pills to turn each drawing type on or off.
- Click Edit Layer on the row to open its settings.
- Pick a tab such as Fill, Line or Point. Its switch must read Enabled for the style controls to show.
- Click Back to Bundle Layers when you are done.
Tips
- Reset to Defaults at the bottom of a tab undoes your changes on that tab.
- Save the bundle afterwards to keep the new look.
Custom colormaps
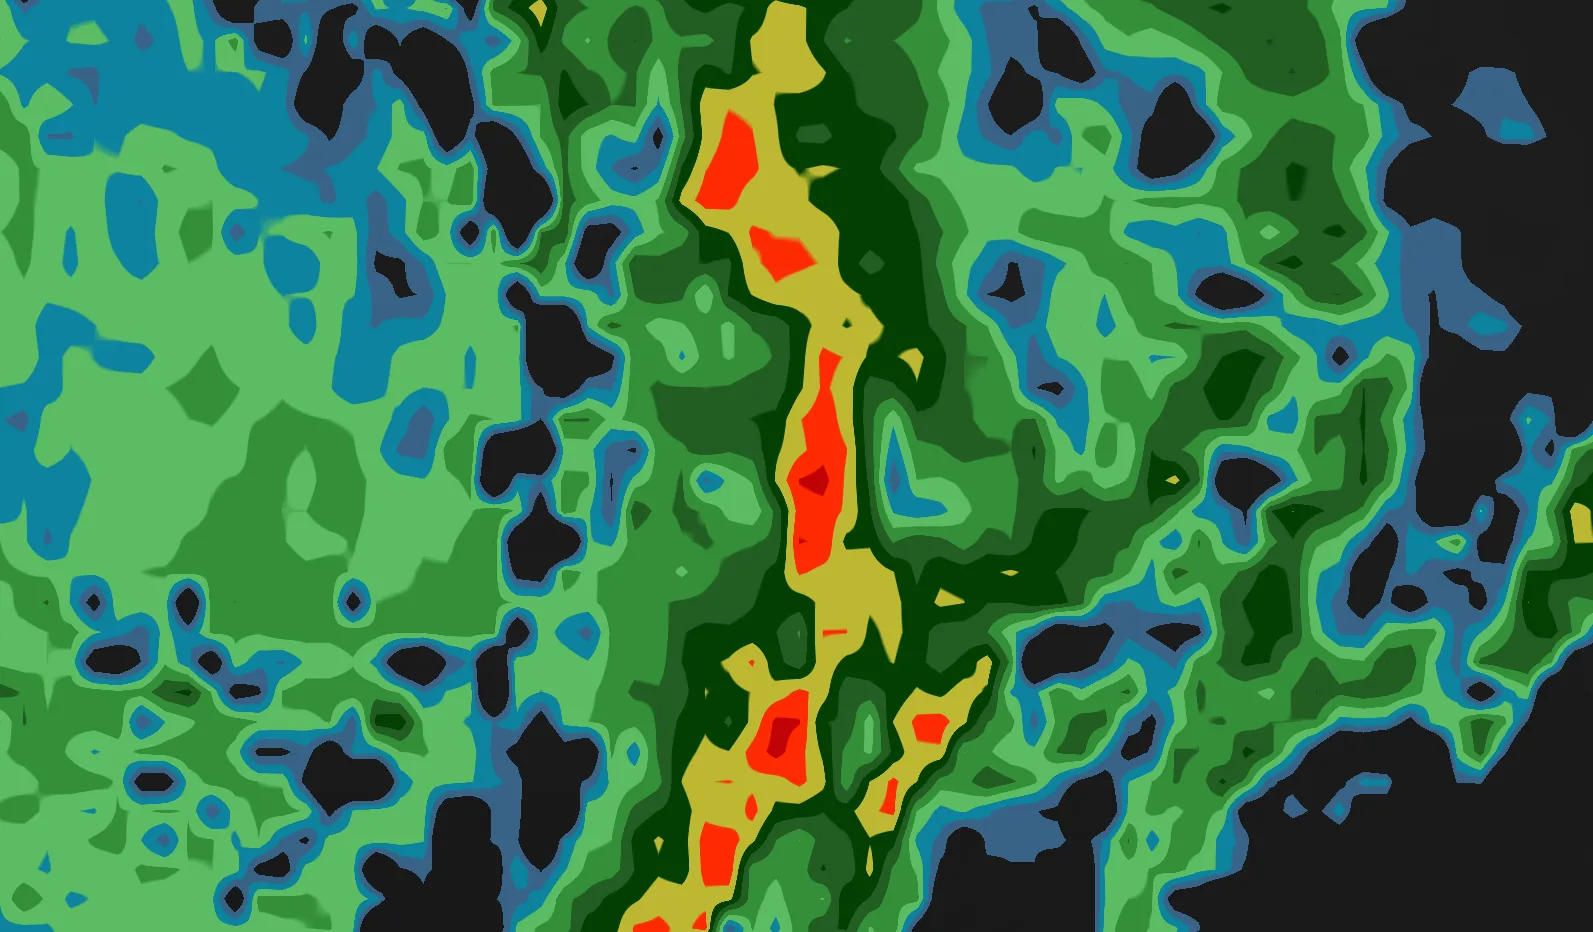
Set your own breakpoints, colors and opacity at each stop, with smooth or hard steps. You can also import .pal files.
Show me in the app- Click Edit Layer on a layer, then the Fill tab (or Line for contour colors).
- Set Colormap Type to custom colormap.
- Click a color swatch to change its color.
- Click a breakpoint number to change its value, set its Opacity or remove it.
- To add a stop, type a value in the field under the stops and click Add.
- Turn Interpolate Colors off for hard color steps, or on for smooth blending.
- Click Save Colormap to keep it, or Set as default colormap to use it whenever this variable loads.
To import a palette, click Load Colormap, open Import .pal file, then click Choose .pal file or paste the text and click Apply .pal. Color tables shared from Wx Tools open from their link and apply to the matching radar product.
Tips
- The Opacity control under the stops can change every stop at once, or only those above, below or between values you set.
- In Settings → Data, switch the list to Colormap groups to change one palette for every variable that shares it.
Sign in to save colormaps. .pal import isn’t shown on phones.
Map styles
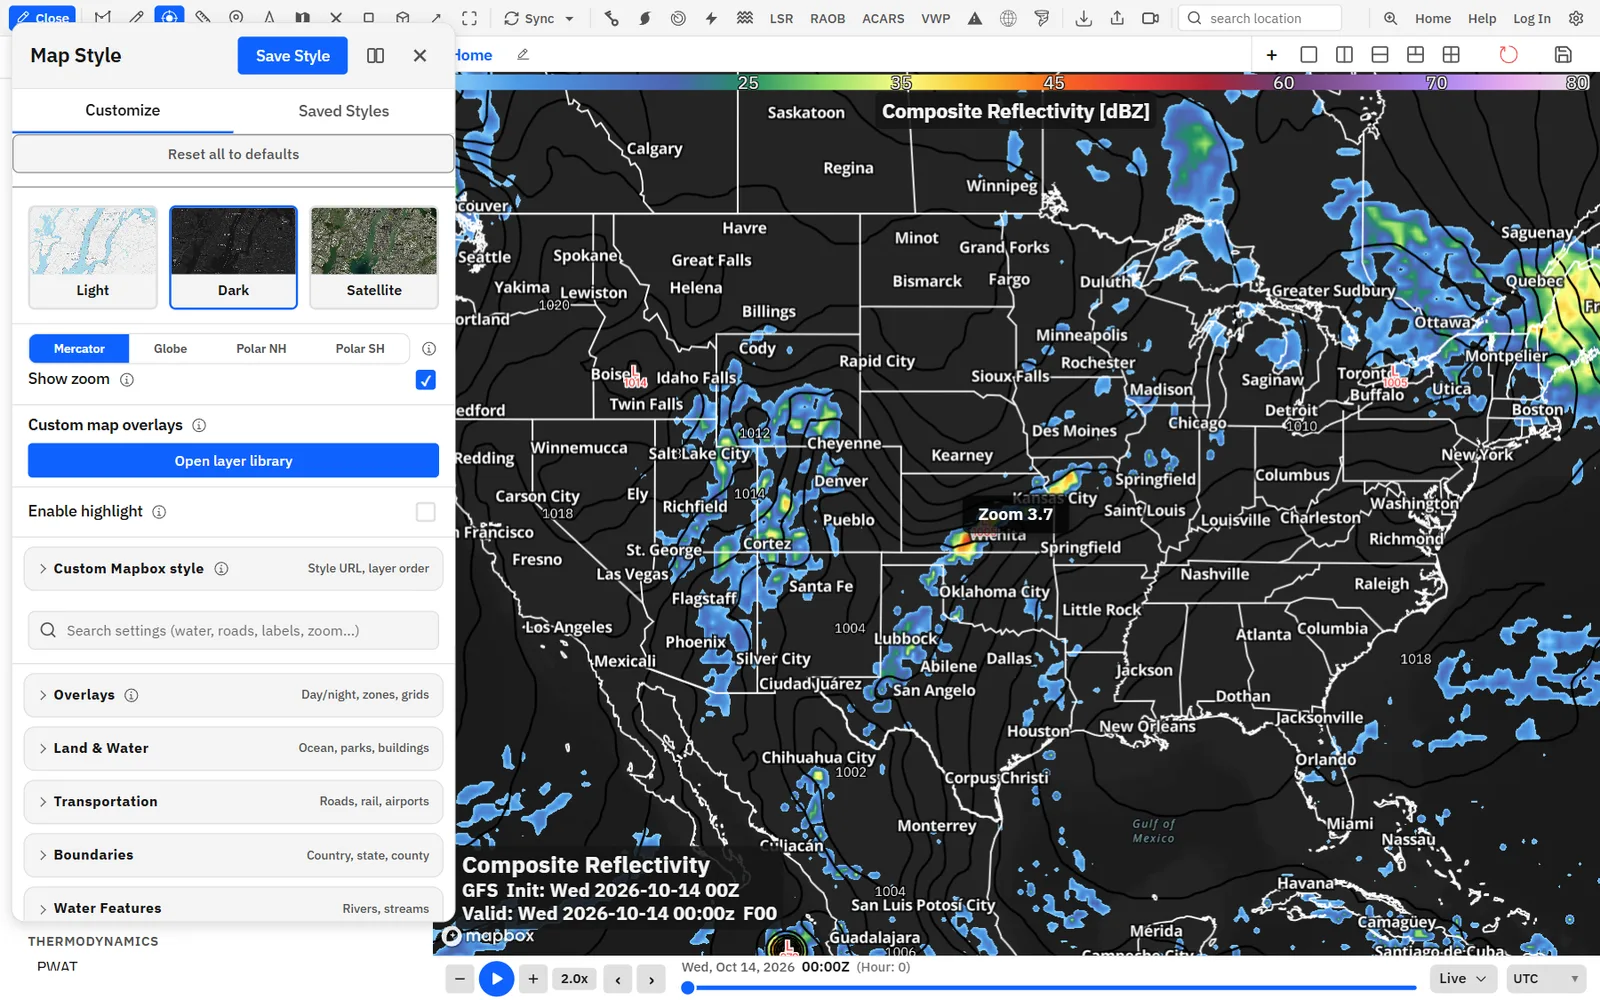
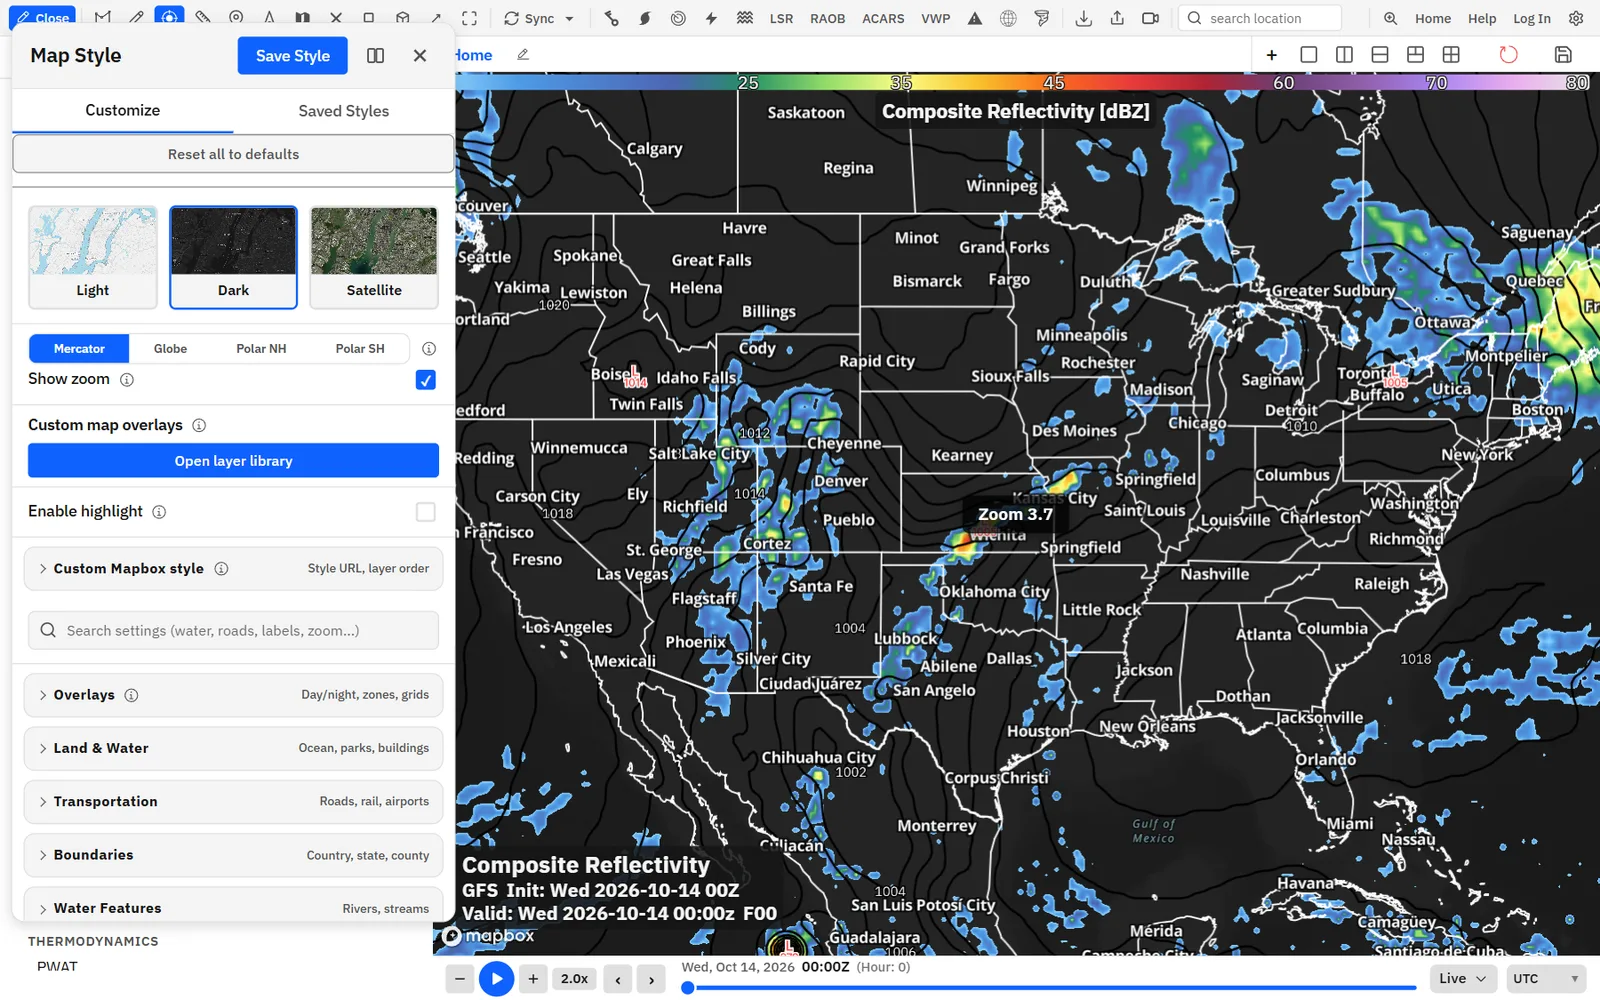
Choose a light, dark or satellite basemap, then decide which roads, borders, labels, terrain and buildings show and at which zoom levels.
Show me in the app- Click the Map style button on the toolbar.
- On the Customize tab, pick a basemap: Light, Dark or Satellite.
- Open a section such as Labels, Boundaries, Transportation, Land & Water or Terrain, or type in the search box to find a setting.
- Change what you need. The map updates as you go.
- Click Save Style, enter a Style Name and save it. Reload it later from the Saved Styles tab.
Tips
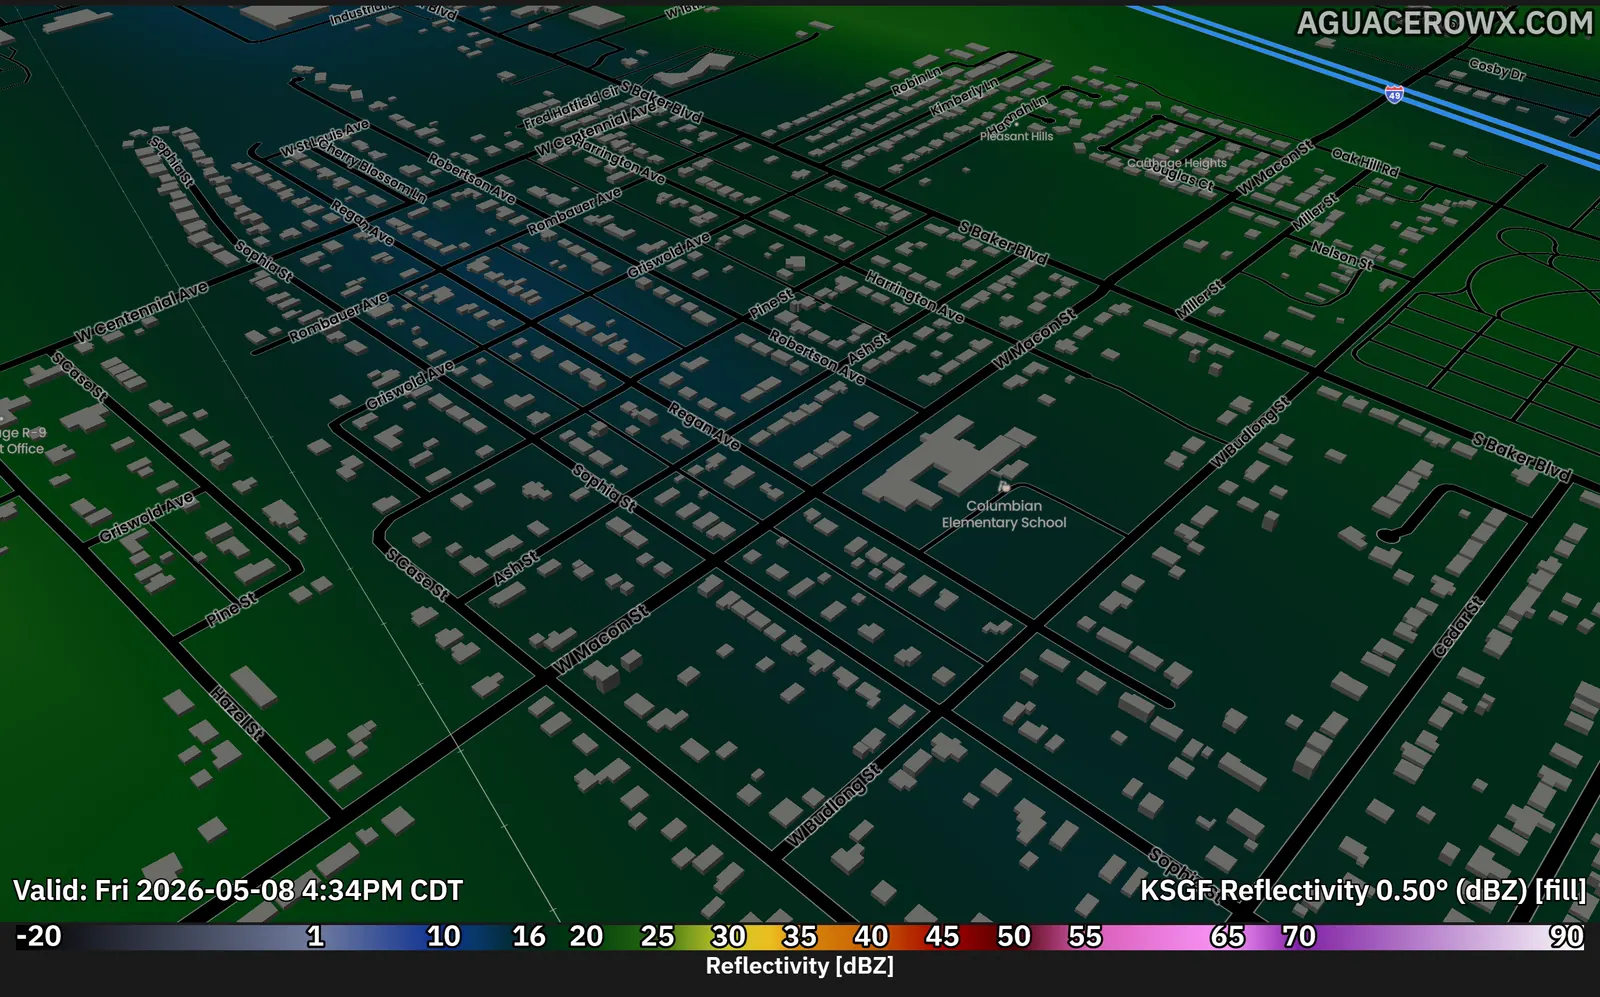
- County names are under Labels → County Labels. Lat/lon lines and the day/night shading are under Overlays. Hillshade and 3D terrain are under Terrain, and 3D buildings under Land & Water.
- Many features have a Zoom range with Min and Max, so they only show at the zoom levels you want.
- Turn off Private map style? when saving to let others find the style. Search public styles under Saved Styles → Advanced.
Sign in to save styles. Free saves 1 map style; Enthusiast and up save as many as you like.
Point readouts
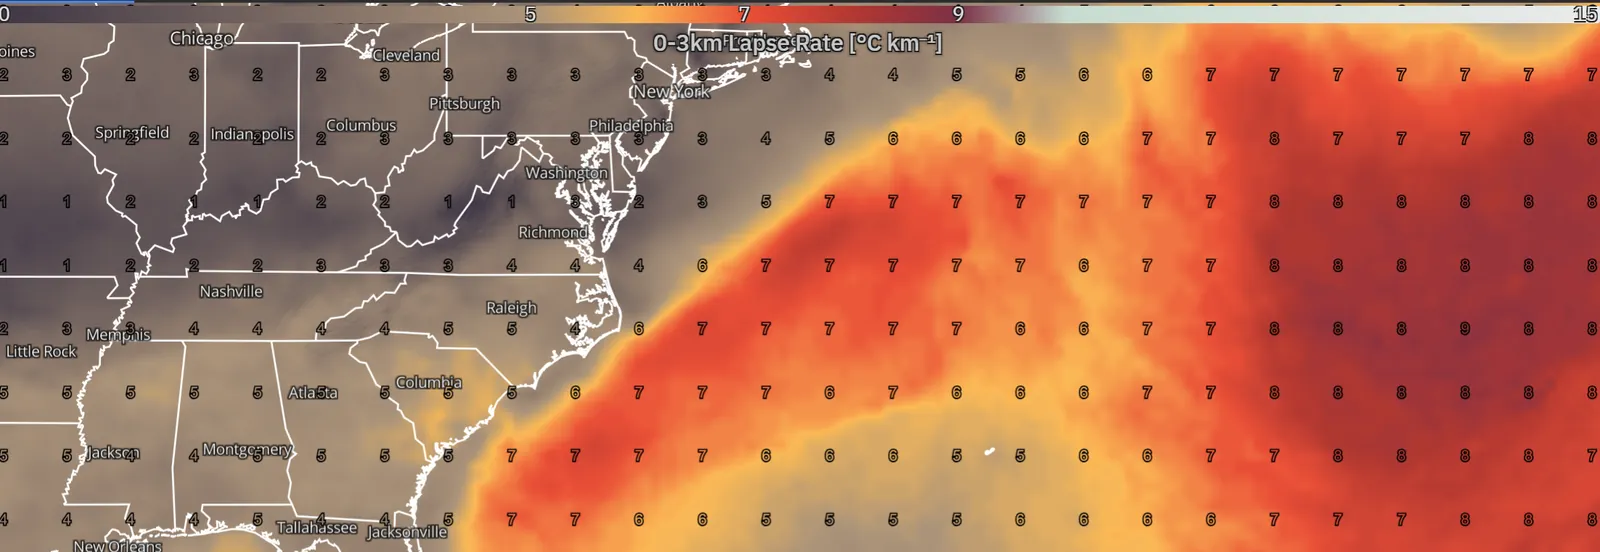
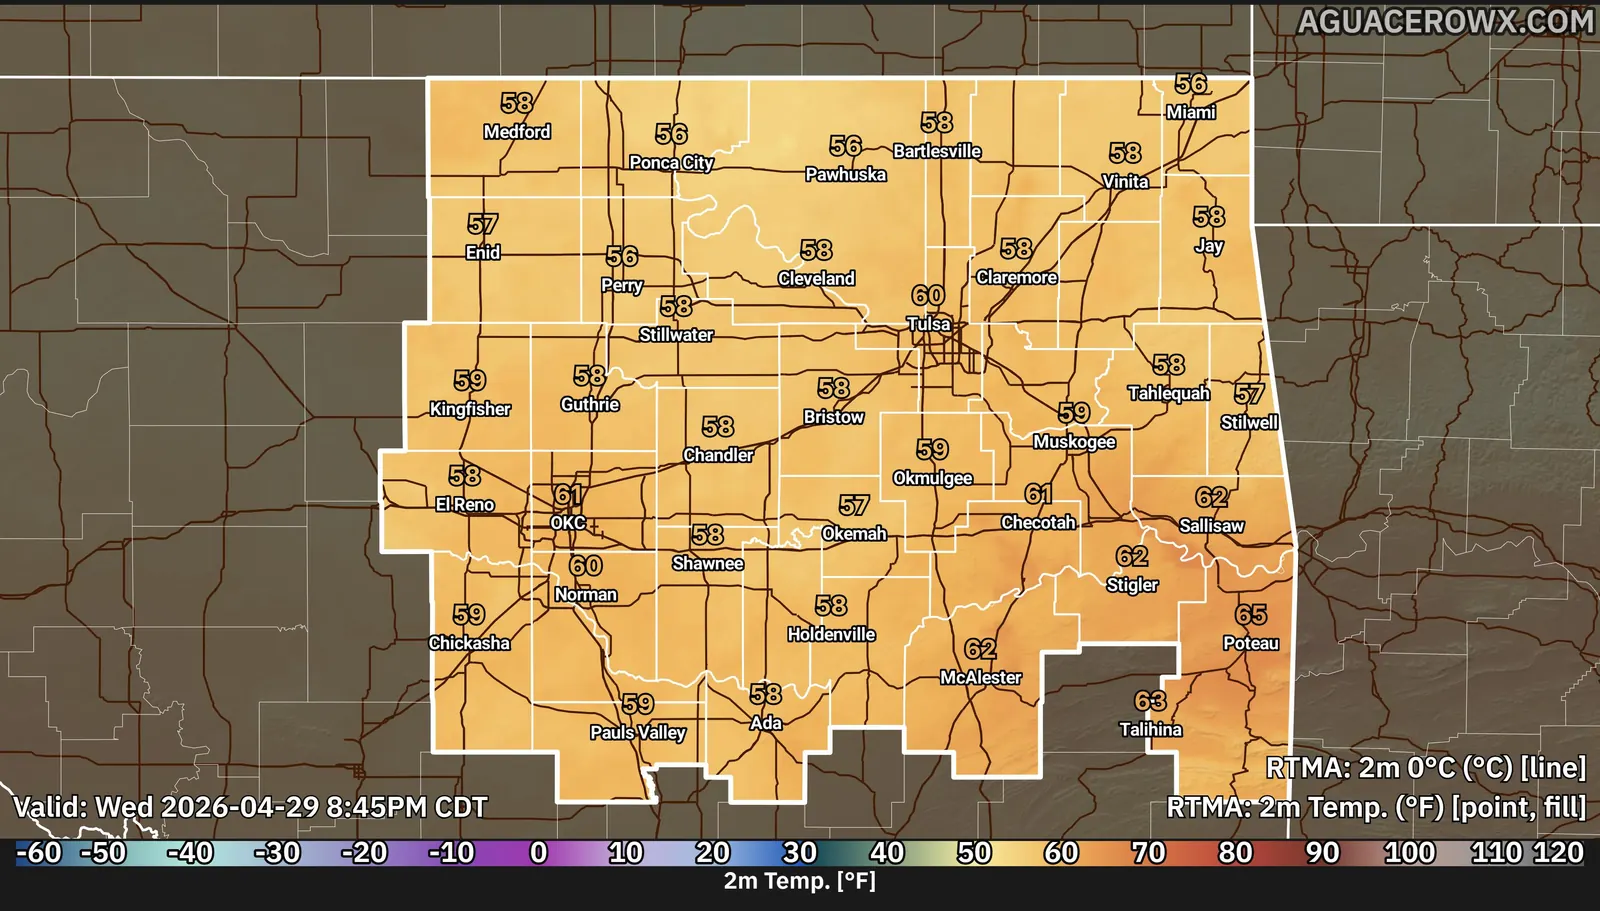
Print values on the map on a regular grid or at cities, with your choice of font, decimals, units and background.
Show me in the app- In Edit Layers, turn on the Point pill for the layer.
- Click Edit Layer, then the Point tab.
- Set Font, Font Size and Decimal Places. Turn on Show units on readouts to add units.
- Add Stroke, Background or Drop shadow so the numbers stand out.
- Under Readout Type, click Switch to City for values at cities, or Switch to Grid for a grid. Point Distance sets the grid spacing.
Tips
- To show the highest and lowest value in view, open Select Data → Layout and turn on Show viewport min/max.
- Upload your own fonts in Settings → Fonts (Professional) to use them in readouts.
Barbs, vectors, particles and streamlines
Draw wind as barbs or vectors on a grid or at cities, or animate it as particles or streamlines.
Show me in the app- In Edit Layers, click Edit Layer on a wind layer, then the Barb or Vector tab.
- In Wind display, choose Barbs, Vectors, Streamlines or Particles.
- For barbs and vectors, set the size and distance sliders. Under Readout Type, click Switch to City to plot at cities.
- For particles, adjust Particle density, Particle length, Particle speed and Speed exaggeration.
- To reuse particle or streamline settings, click Save as wind display default.
Tips
- Settings → Data → Wind display sets one display for every bundle you load. Bundle/Variable keeps each layer’s own choice.
Contours and line labels
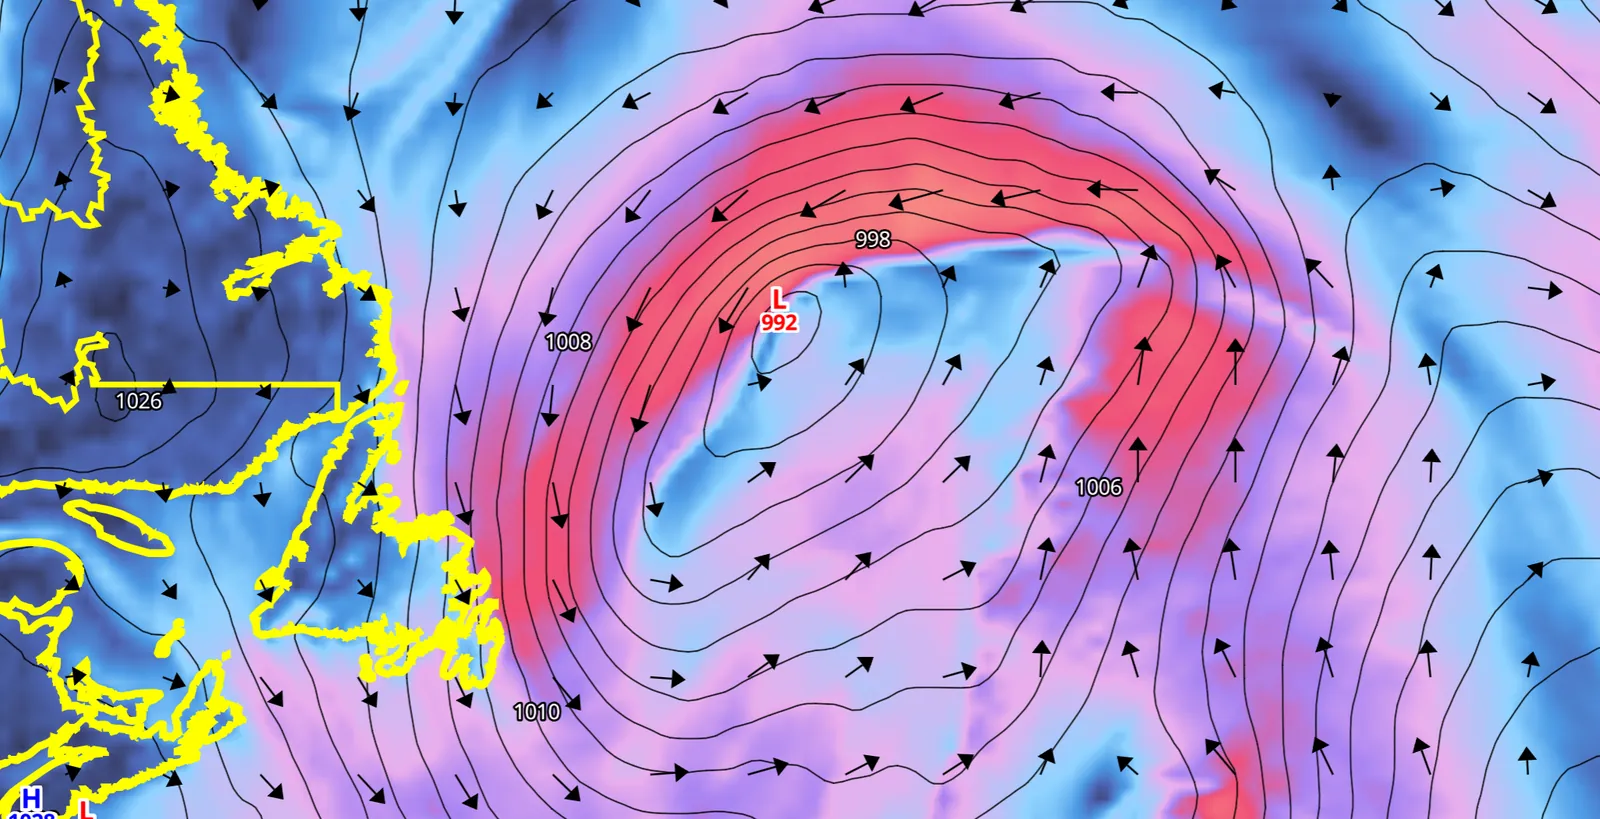
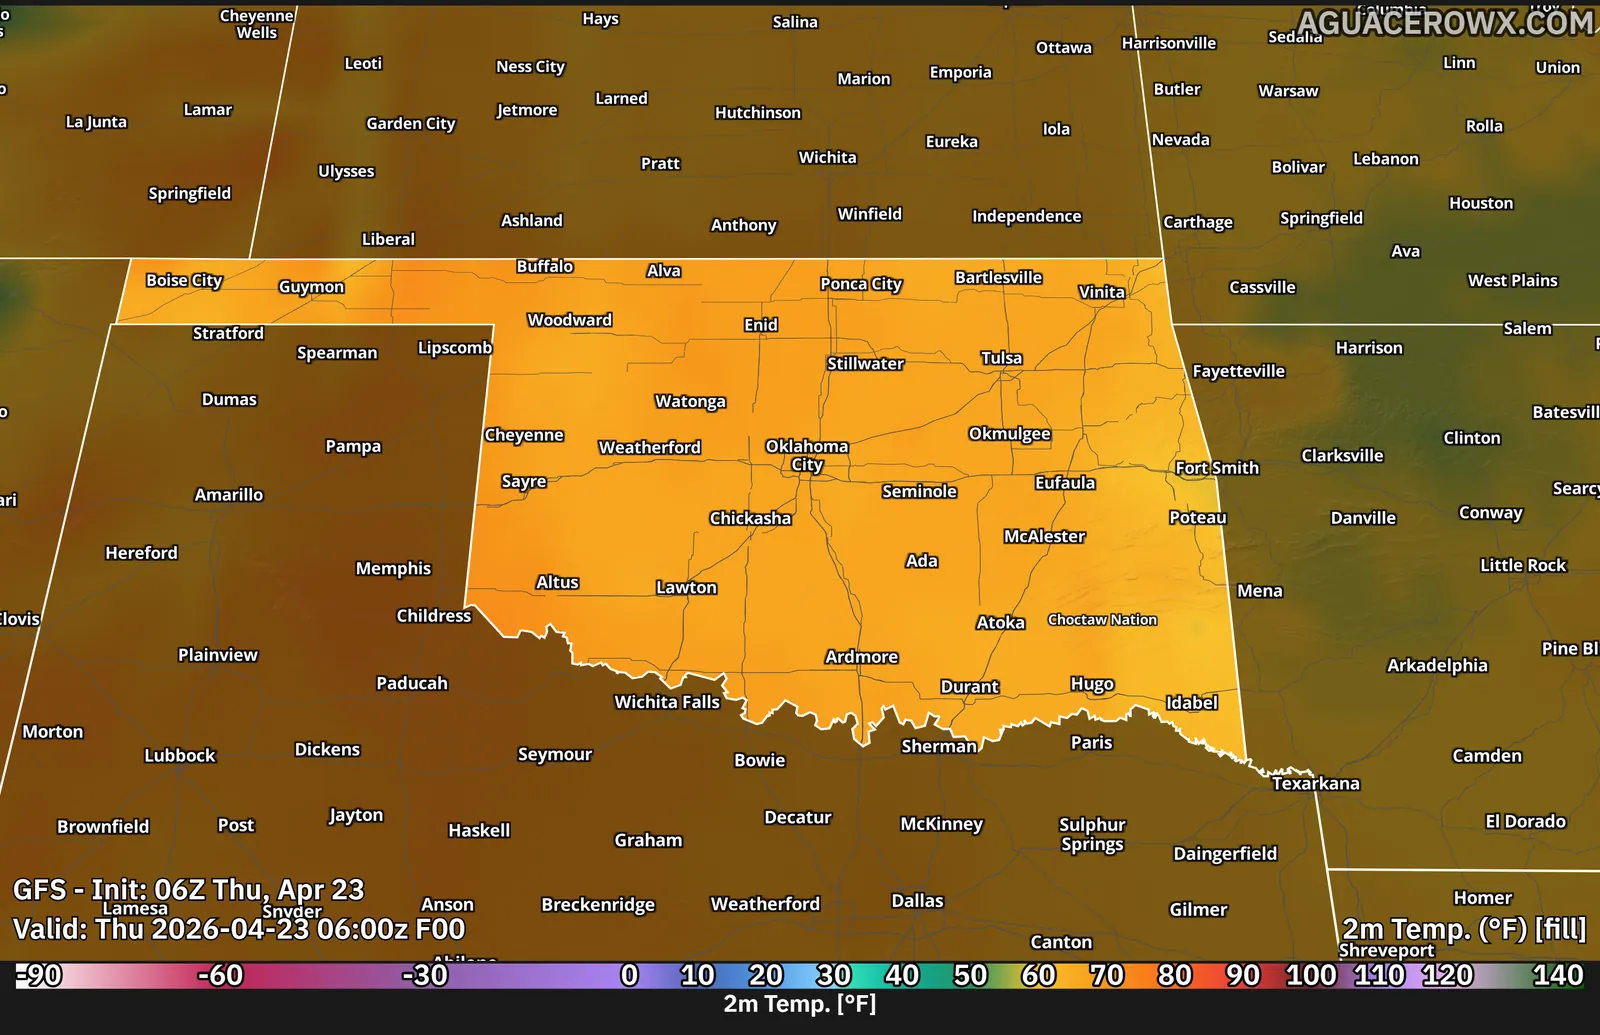
Draw any field as contours with your own interval, line style and label font.
Show me in the app- In Edit Layers, turn on the Line pill for the layer.
- Click Edit Layer, then the Line tab.
- Under Contour intervals, choose Uniform step and set Step between isolines, or choose Custom levels, type values in Isoline values and click Apply.
- Set Width and Line Style: Solid, Dashed, Dotted or Dash-Dot.
- Turn on Show isoline labels, then set Font Size, Font, Outline and Label color.
Tips
- Sea-level pressure also has Show Highs/Lows, with its own font and colors.
- Settings → Data → Layer styles → Contours sets line and label defaults for every bundle.
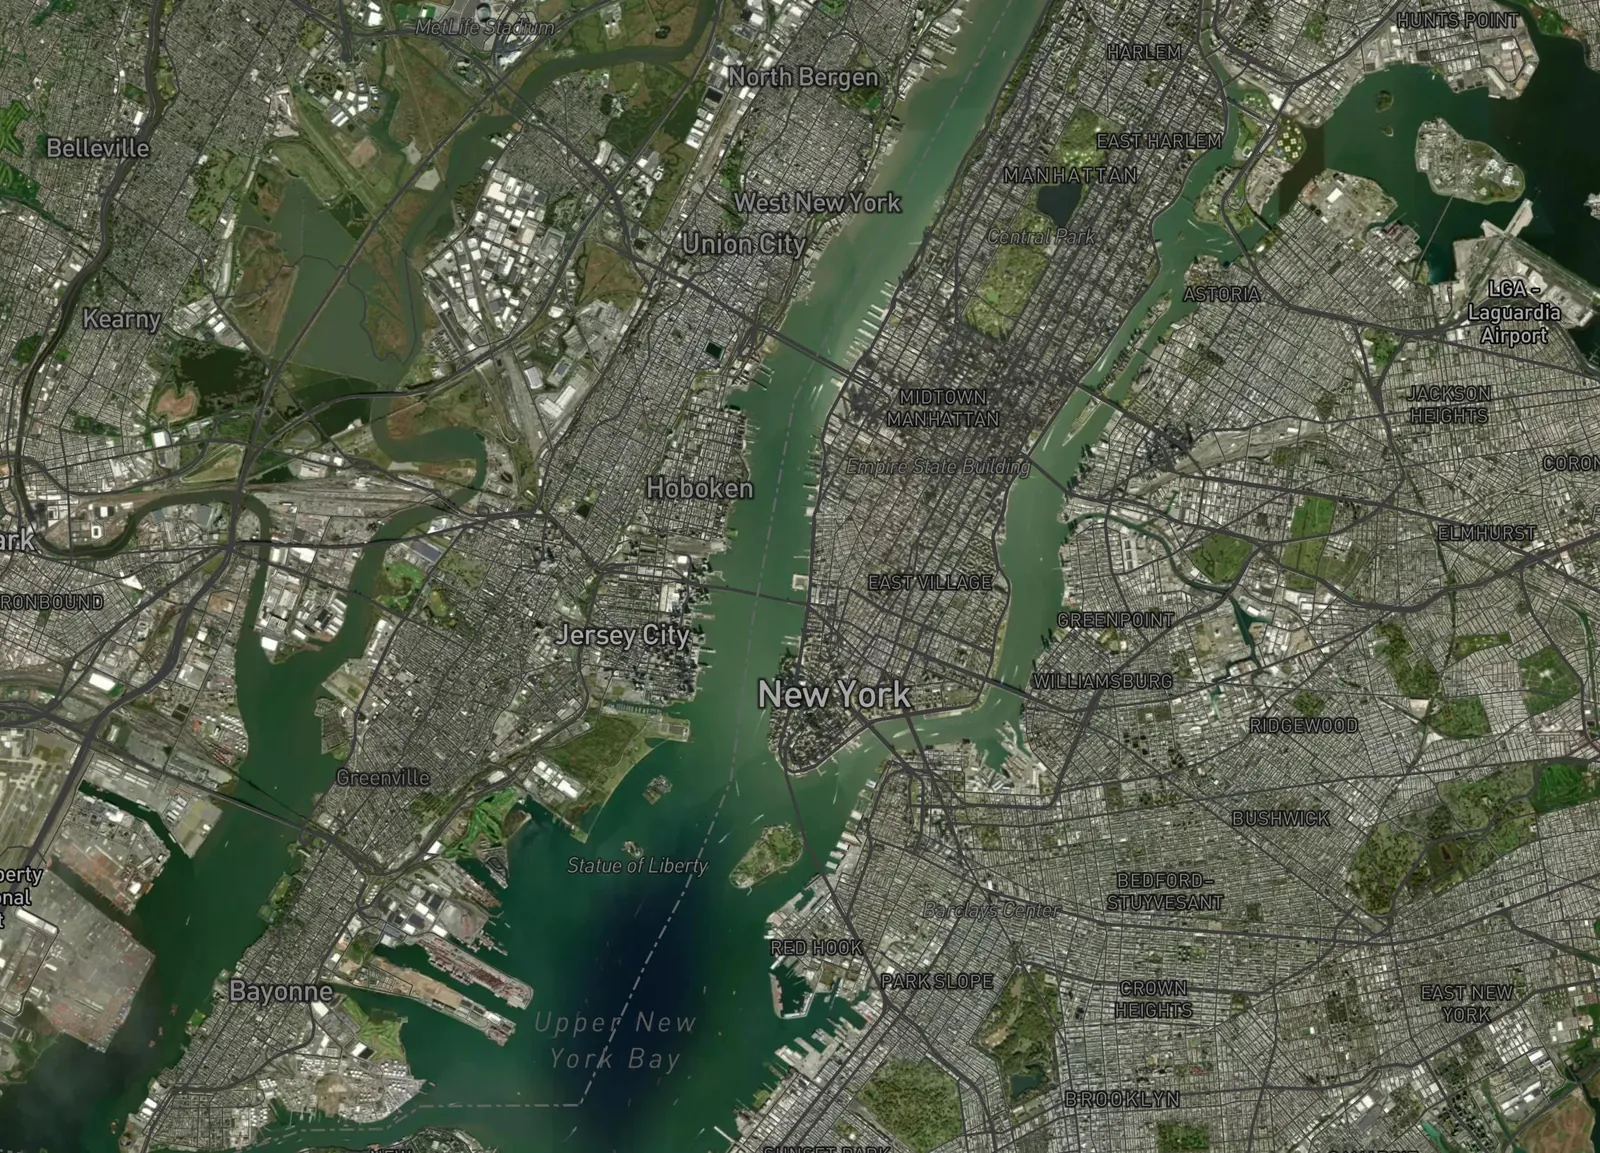
Satellite basemap
Put satellite imagery under your data and tune how strong it looks.
Show me in the app- Click the Map style button on the toolbar.
- On the Customize tab, click the Satellite basemap card.
- Open the Satellite imagery section.
- Drag Saturation and Contrast. Use Shadow lift and Highlight ceiling to brighten or darken the imagery.
Highlight areasProfessional
Pick countries, states or counties to keep bright and tint everything else, with an optional drop shadow on the outline.
Show me in the app- Click the Map style button on the toolbar.
- On the Customize tab, turn on Enable highlight.
- Under Boundary level, choose Countries, States / provinces or Counties (US).
- Click Tap map to add/remove and click areas on the map, or search for them by name.
- Set Outside tint color and Outside tint opacity, and turn on Outline drop shadow if you want one.
- Turn on Hide labels outside highlight to drop city labels, markers and point readouts outside the area.
Tips
- Type a name under Save highlight and click Save to layer library to reuse the selection.
Custom layersProfessional
Add your own GeoJSON or shapefile shapes, uploaded once or kept current from a URL.
Show me in the app- In Edit Layers, click Add Layer and choose Custom Layer. The Custom layer library opens.
- On Upload file, drop a GeoJSON file, a zipped shapefile, or a .shp with its .dbf.
- Or, on Live link, paste the file’s URL and click Continue.
- Enter a name in Name this layer. For a live link, choose how often to Download again.
- Click Save & Load.
- Click Edit Layer on the new row to style its colors, outline and labels.
Tips
- To put a layer on the basemap instead, open Map style and use Open layer library under Custom map overlays.
- Rename or delete saved files in Settings → Custom layers.
PlacefilesProfessional
Load GRLevelX-style placefiles, such as spotter feeds, as map layers from a file or a live URL.
Show me in the app- In Edit Layers, click Add Layer and choose Custom Layer.
- Upload a .txt or .plr placefile on Upload file, or paste a placefile URL on Live link and click Continue.
- Name it and click Save & Load.
- Click Edit Layer on its row to set Opacity, Icon size and Text size, and to turn Show icons or Show text on or off.
- For a live placefile, choose a Refresh interval, or click Refresh now.
Tips
- Saved placefiles carry a Placefile badge in the layer library.
Custom Mapbox stylesProfessional
Use a style you designed in Mapbox Studio as the basemap under your data.
Show me in the app- In Mapbox Studio, copy your style’s URL. It starts with mapbox://styles/.
- Click the Map style button on the toolbar.
- On the Customize tab, open Custom Mapbox style.
- Paste the URL. If the style needs one, add your Mapbox access token.
- Click Load style.
Tips
- Click Save Style to keep the custom basemap in a saved map style.
- Click Clear custom style to go back to the built-in basemaps.