Load NEXRAD radar
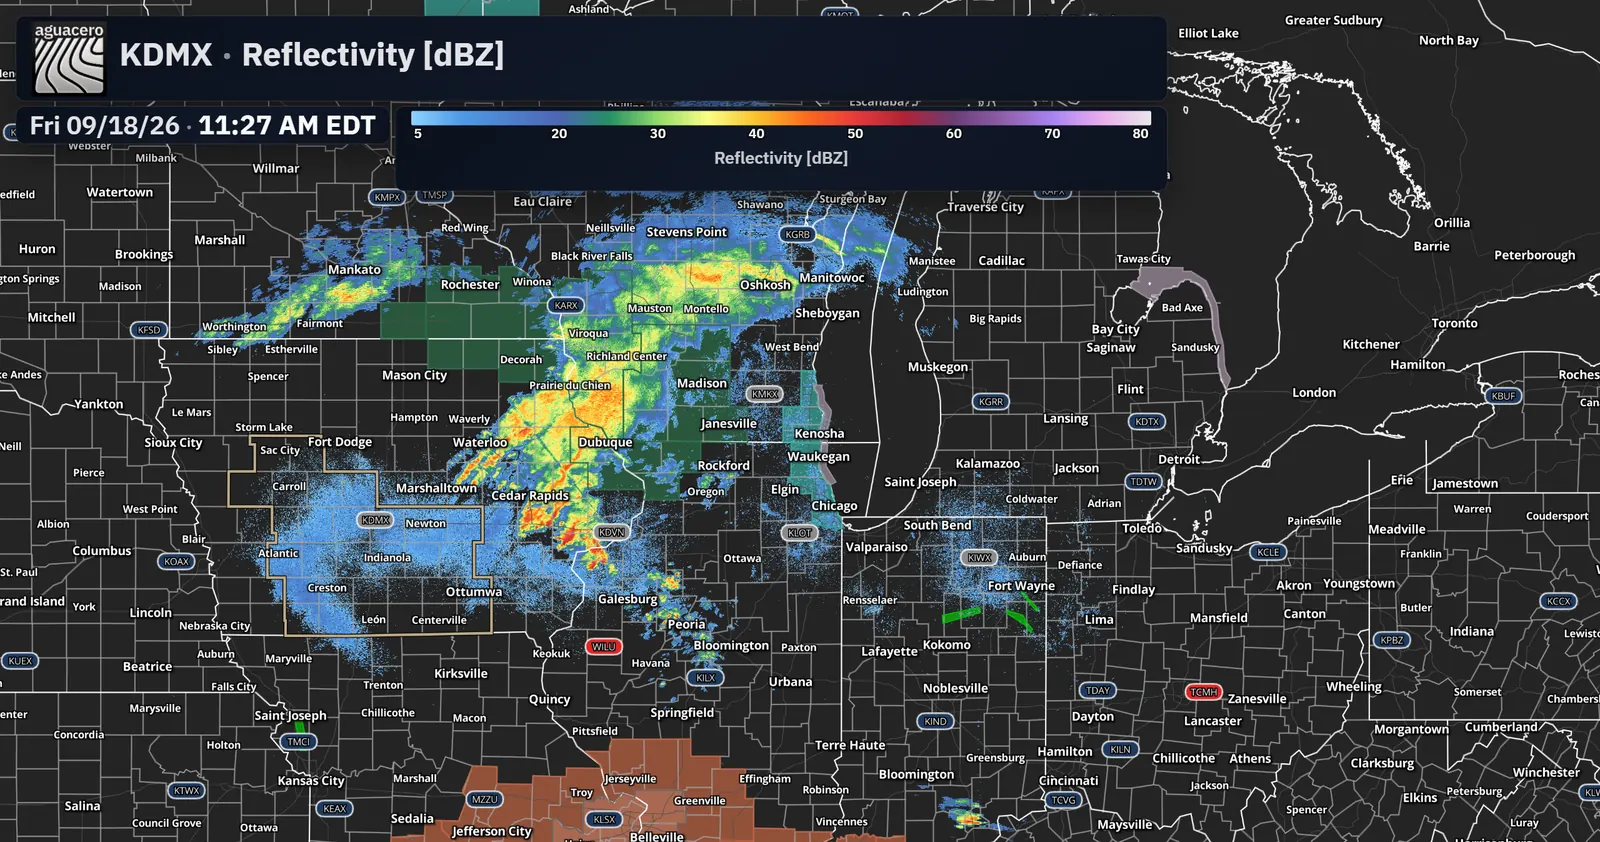
Show any WSR-88D or TDWR site with every tilt: reflectivity, velocity, dual-pol moments and Level III products such as echo tops, VIL and rainfall totals.
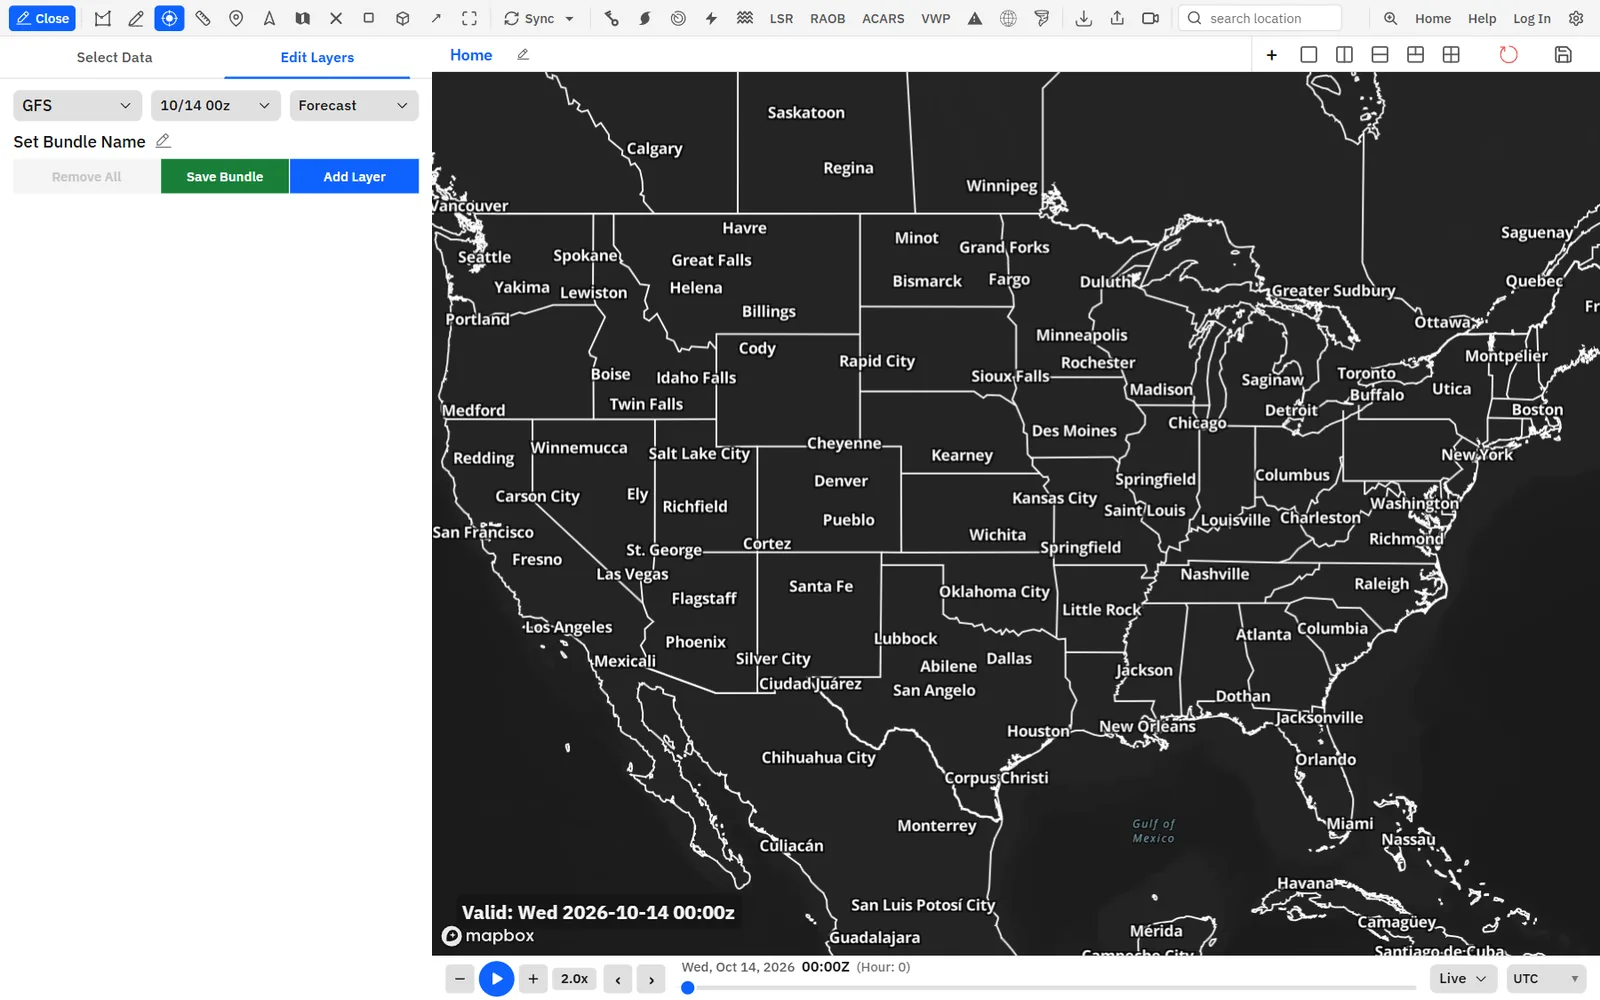
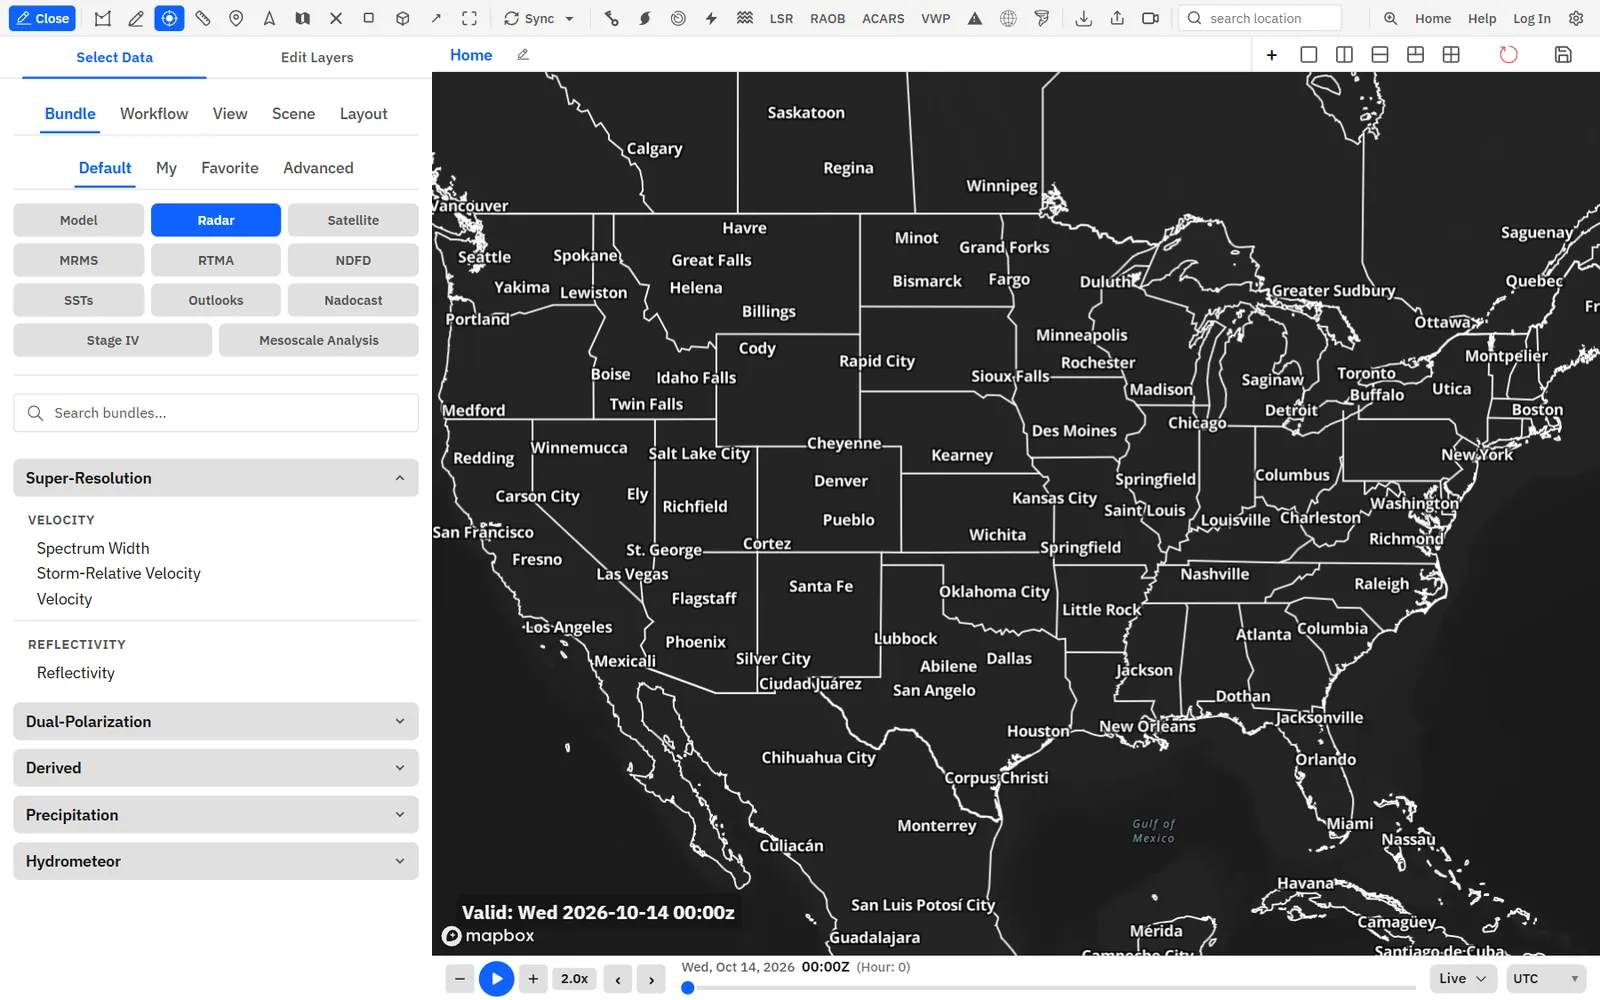
Show me in the app- Click the Edit Layers tab in the sidebar.
- Click Add Layer, then Radar, and pick a product.
- Double-click NEXRAD sites on the toolbar to show the radar sites.
- Click a site on the map to load its data.
- Click Tilt on the layer row to pick an elevation angle.
Tips
- Right-click the map and choose Nearest NEXRAD to load reflectivity from the closest site.
- Click the product name on the layer row to swap to another product.
- With a NEXRAD layer active, the keys below switch products and tilts.
Shortcuts
- R
- Base reflectivity
- V
- Base velocity
- W
- Spectrum width
- S
- Storm-relative velocity
- Z
- Differential reflectivity (ZDR)
- C
- Correlation coefficient
- K
- Specific differential phase (KDP)
- P
- Differential phase
- E
- Echo tops
- L
- Vertically integrated liquid (VIL)
- ↑ / ↓
- Raise or lower the tilt
- ← / →
- Step back or forward one frame
Storm-relative velocity
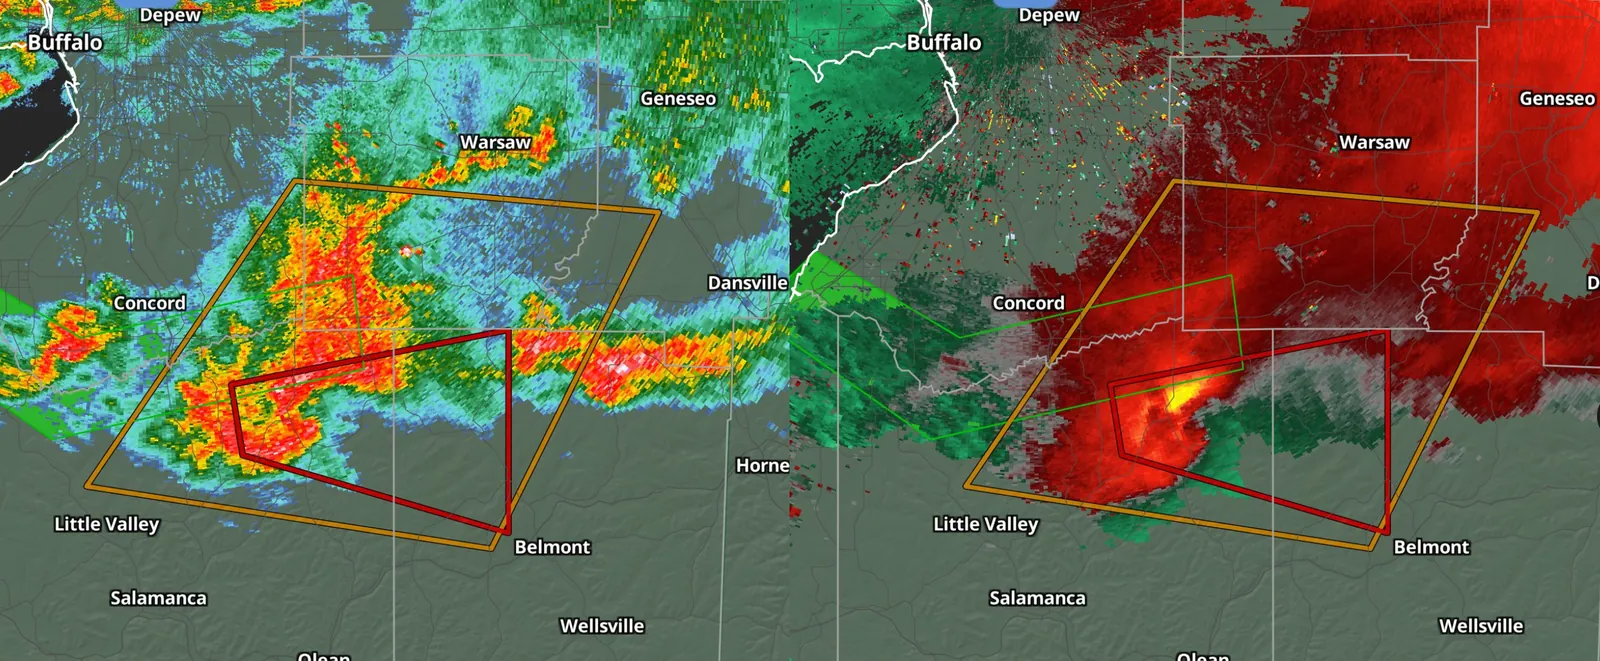
Take the storm’s own motion out of the velocity data so rotation is easier to see. Use the Level III motion, take it from an NWS warning, or set it yourself.
- With a NEXRAD layer on the map, press S to switch to storm-relative velocity.
- On the Edit Layers tab, click Edit Layer on the radar layer.
- Under Storm-relative motion, choose Level III, NWS alert or Manual.
- For NWS alert, click a tornado, severe thunderstorm, special weather statement or marine warning that lists storm motion.
- For Manual, type the Storm speed and set From (°), the direction the storm is moving from.
TDWR sites have base velocity only, not storm-relative velocity.
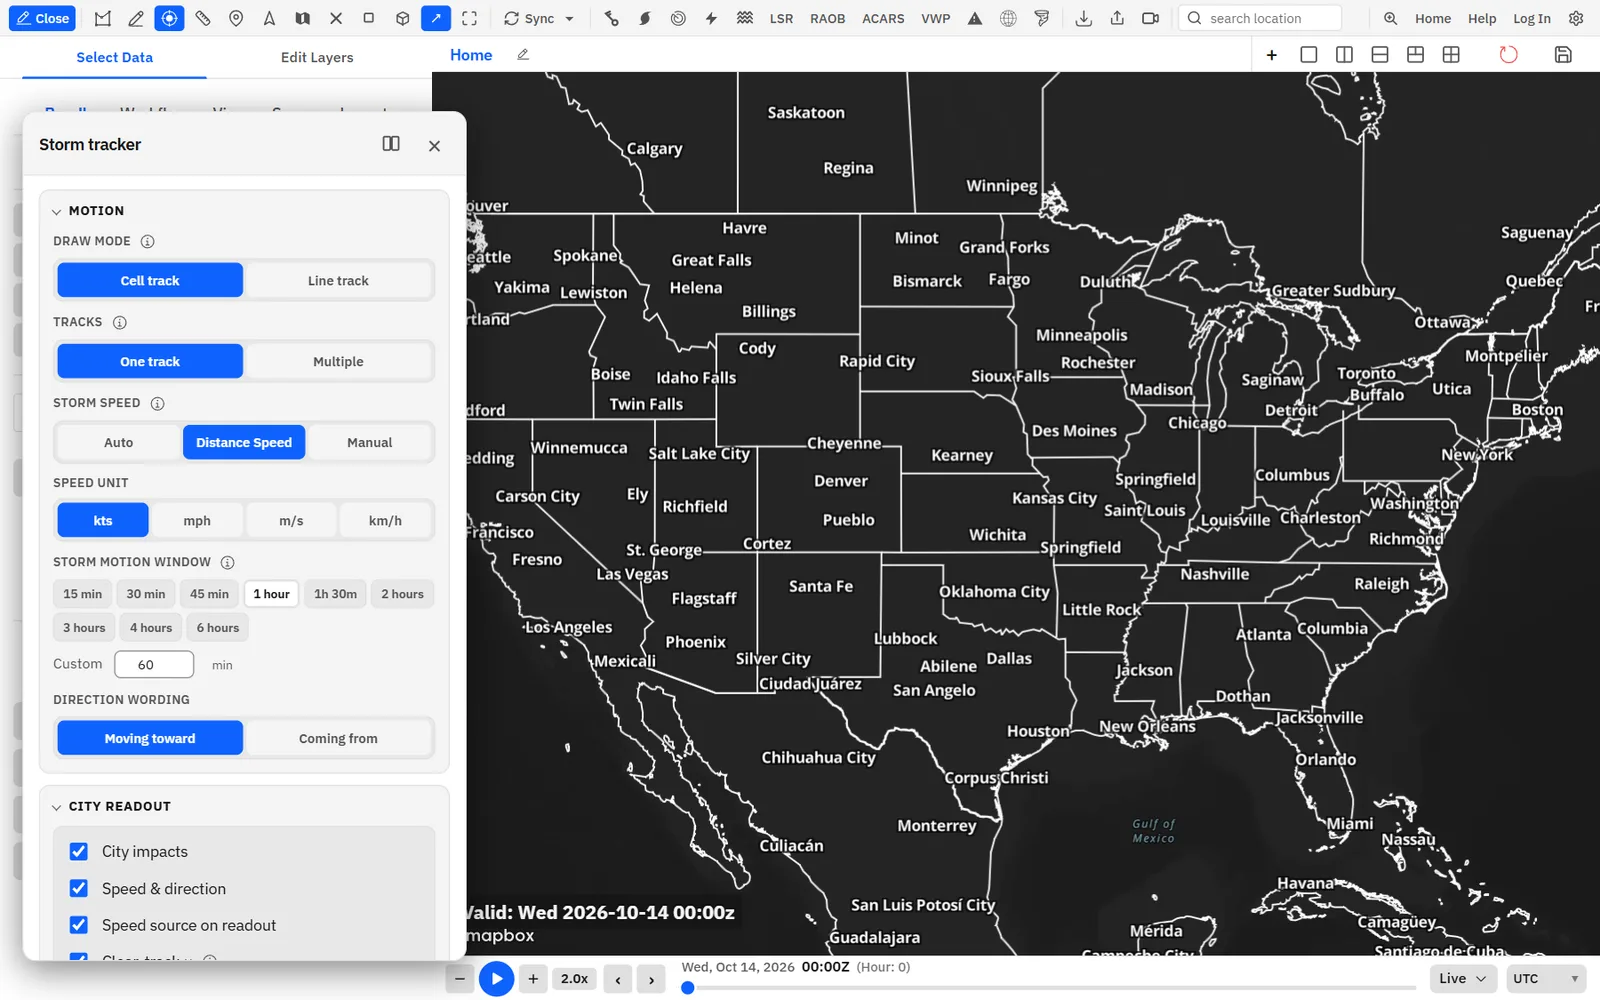
Storm tracker
Draw a storm’s path to see its speed, its cone and the towns in its way with arrival times. Keep one track or several.
Show me in the app- Click Storm tracker on the toolbar to turn it on and open its settings.
- Under Draw mode, choose Cell track or Line track.
- Under Storm speed, choose Auto, Distance Speed or Manual.
- Drag across the storm in the direction it is moving. For a line track, click each point and double-click to finish.
- To keep several tracks, set Tracks to Multiple and click Add another track.
Tips
- Auto pins the track to an NWS warning. Start the track inside the warning polygon and the speed comes from the warning.
- Select a track and press Delete to clear it.
- NEXRAD storm tracks with mesocyclone and TVS markers are a separate Level III overlay. Turn them on in Settings > Data > Radar: click a radar product and tick Storm tracks.
Shortcuts
- T + drag
- Draw a storm track with your saved settings
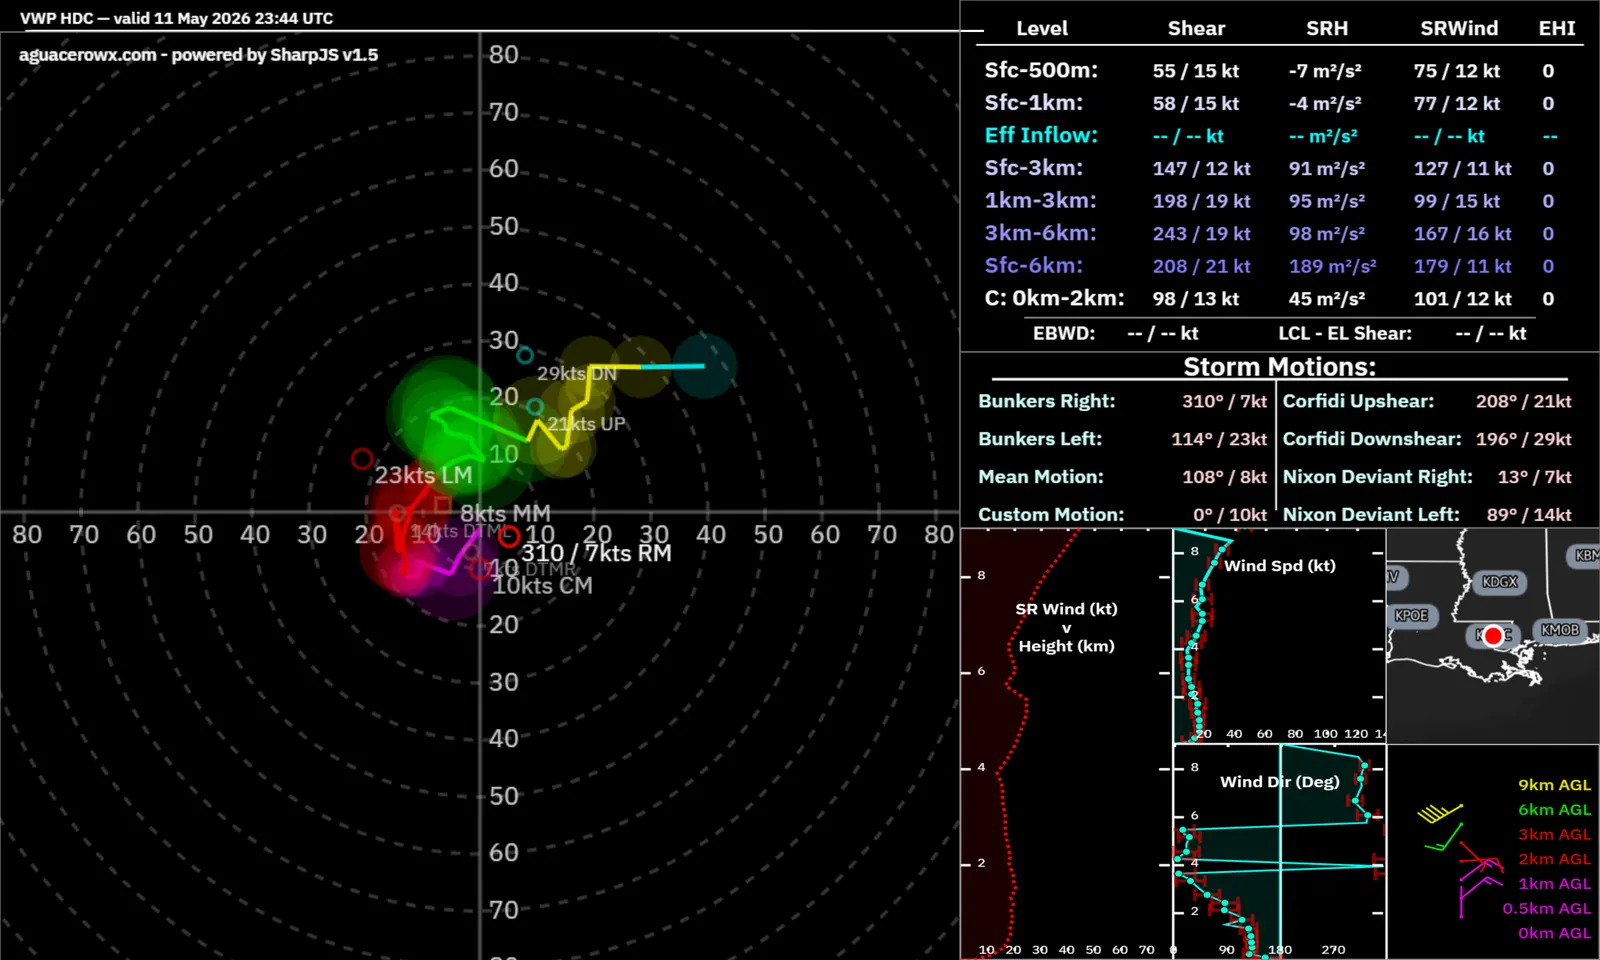
VWP hodographs and winds
See the VAD wind profile from any NEXRAD site as a hodograph with shear and storm motion, as wind barbs on the map, or over time.
Show me in the app- Double-click VWP on the toolbar to show the VWP sites.
- Click a site to open its hodograph.
- Single-click VWP to style the site dots and turn on Show wind barbs.
- Press Shift + ↑ or Shift + ↓ to change the barb height.
- For winds over time, right-click the map and choose VWP time-height.
Tips
- Right-click the map and choose NEXRAD VWP for the hodograph from the nearest site.
Shortcuts
- Shift + ↑ / ↓
- Raise or lower the VWP barb height
MRMS mosaics
Multi-Radar Multi-Sensor mosaics: reflectivity, rotation tracks, hail size, rainfall estimates and 100+ more products, with heights you can switch.
Show me in the app- Click the Edit Layers tab in the sidebar.
- Click Add Layer, then MRMS.
- Pick a category and a product, or search for one, such as Rotation Track or Max Hail Size.
- For products with heights, click Tilt on the layer row, or press ↑ and ↓.
Tips
- Click MRMS in the data type filter on Select Data for ready-made MRMS bundles.
- Double-click Mouse readouts on the toolbar to read values under the cursor.
Every MRMS product is on every plan. Your plan sets how many hours a loop can hold.
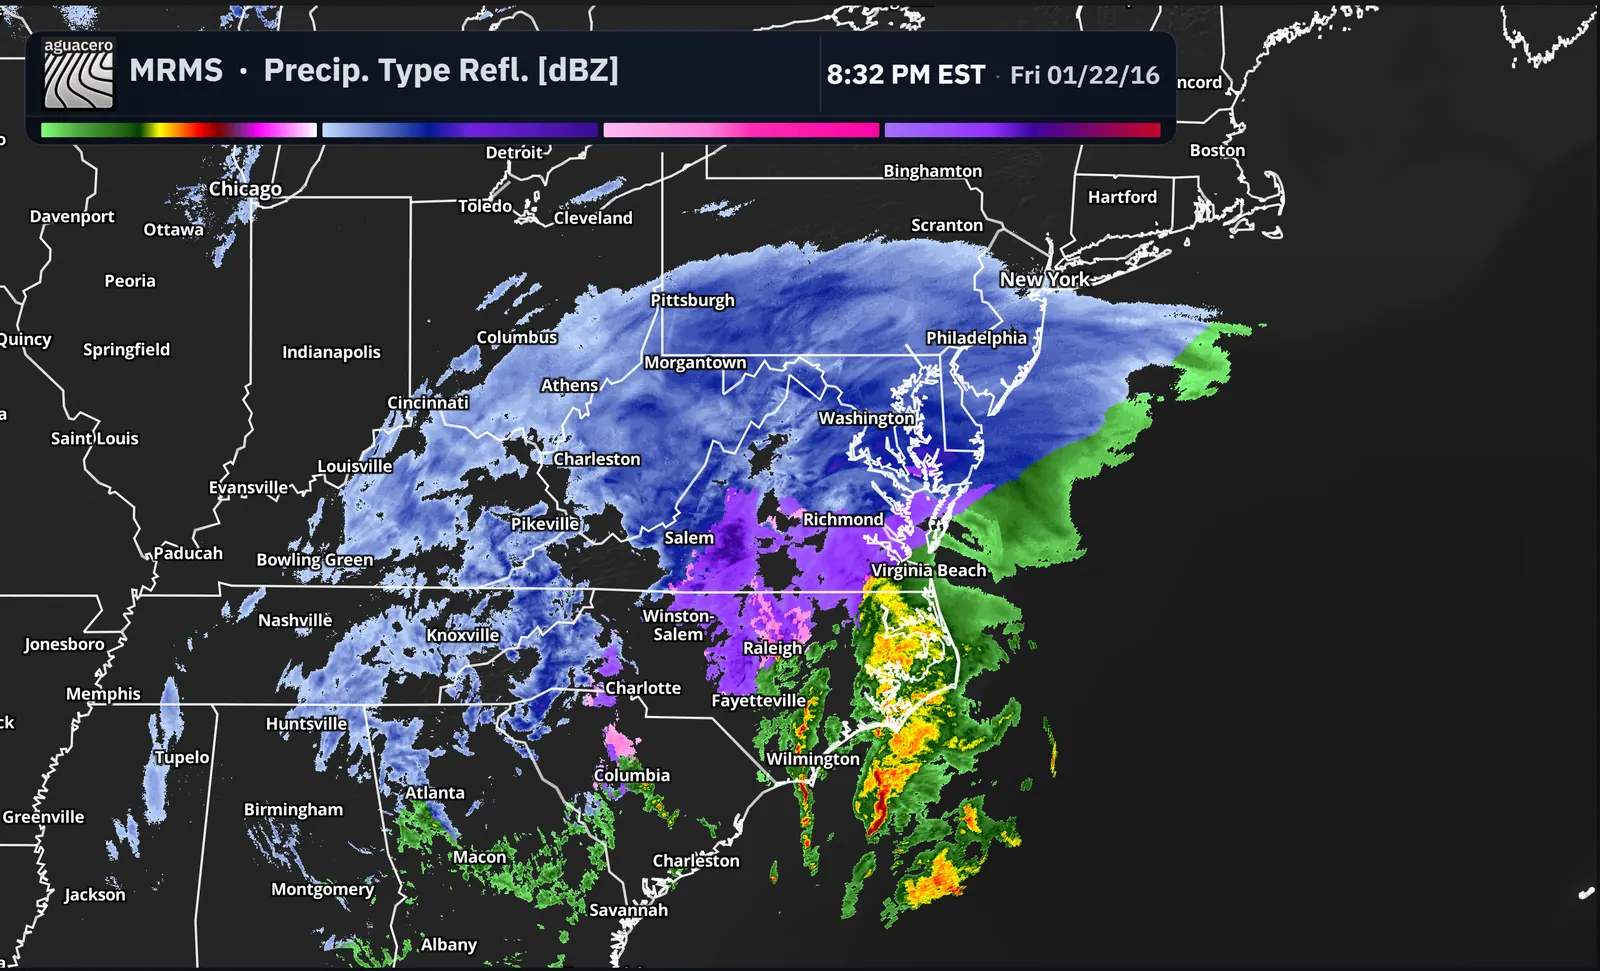
MRMS precipitation type
Reflectivity colored by precipitation type, so rain, snow, sleet and freezing rain stand apart.
Show me in the app- Click the Edit Layers tab, then Add Layer.
- Type Precipitation Type in Search variables....
- Click Precipitation Type Reflectivity under the MRMS heading.
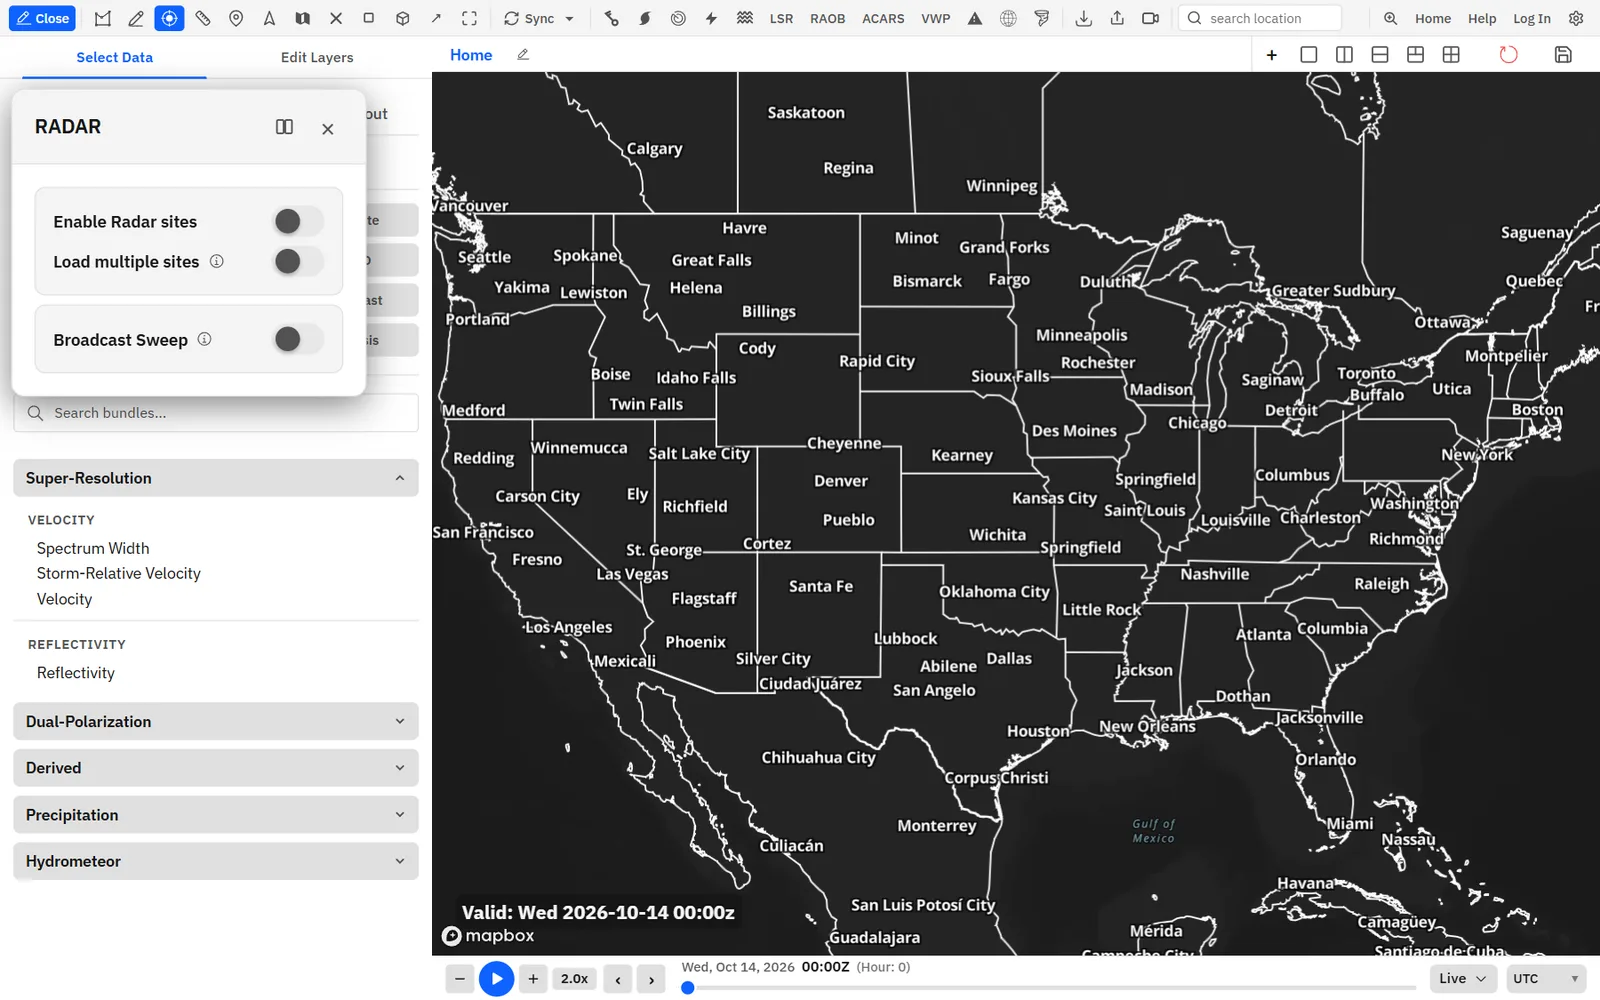
Multiple NEXRAD sitesProfessional
Load up to 5 sites on one radar layer with the same product, tilt and colormap. Where coverage overlaps, the closest site is shown.
Show me in the app- Load a NEXRAD layer on the map.
- Single-click NEXRAD sites on the toolbar to open the RADAR settings.
- Turn on Load multiple sites.
- Click sites on the map to add them, up to 5.
- Click a site again to remove it.
Tips
- Turning on a sixth site turns off the oldest one.
3D NEXRAD volumesProfessional
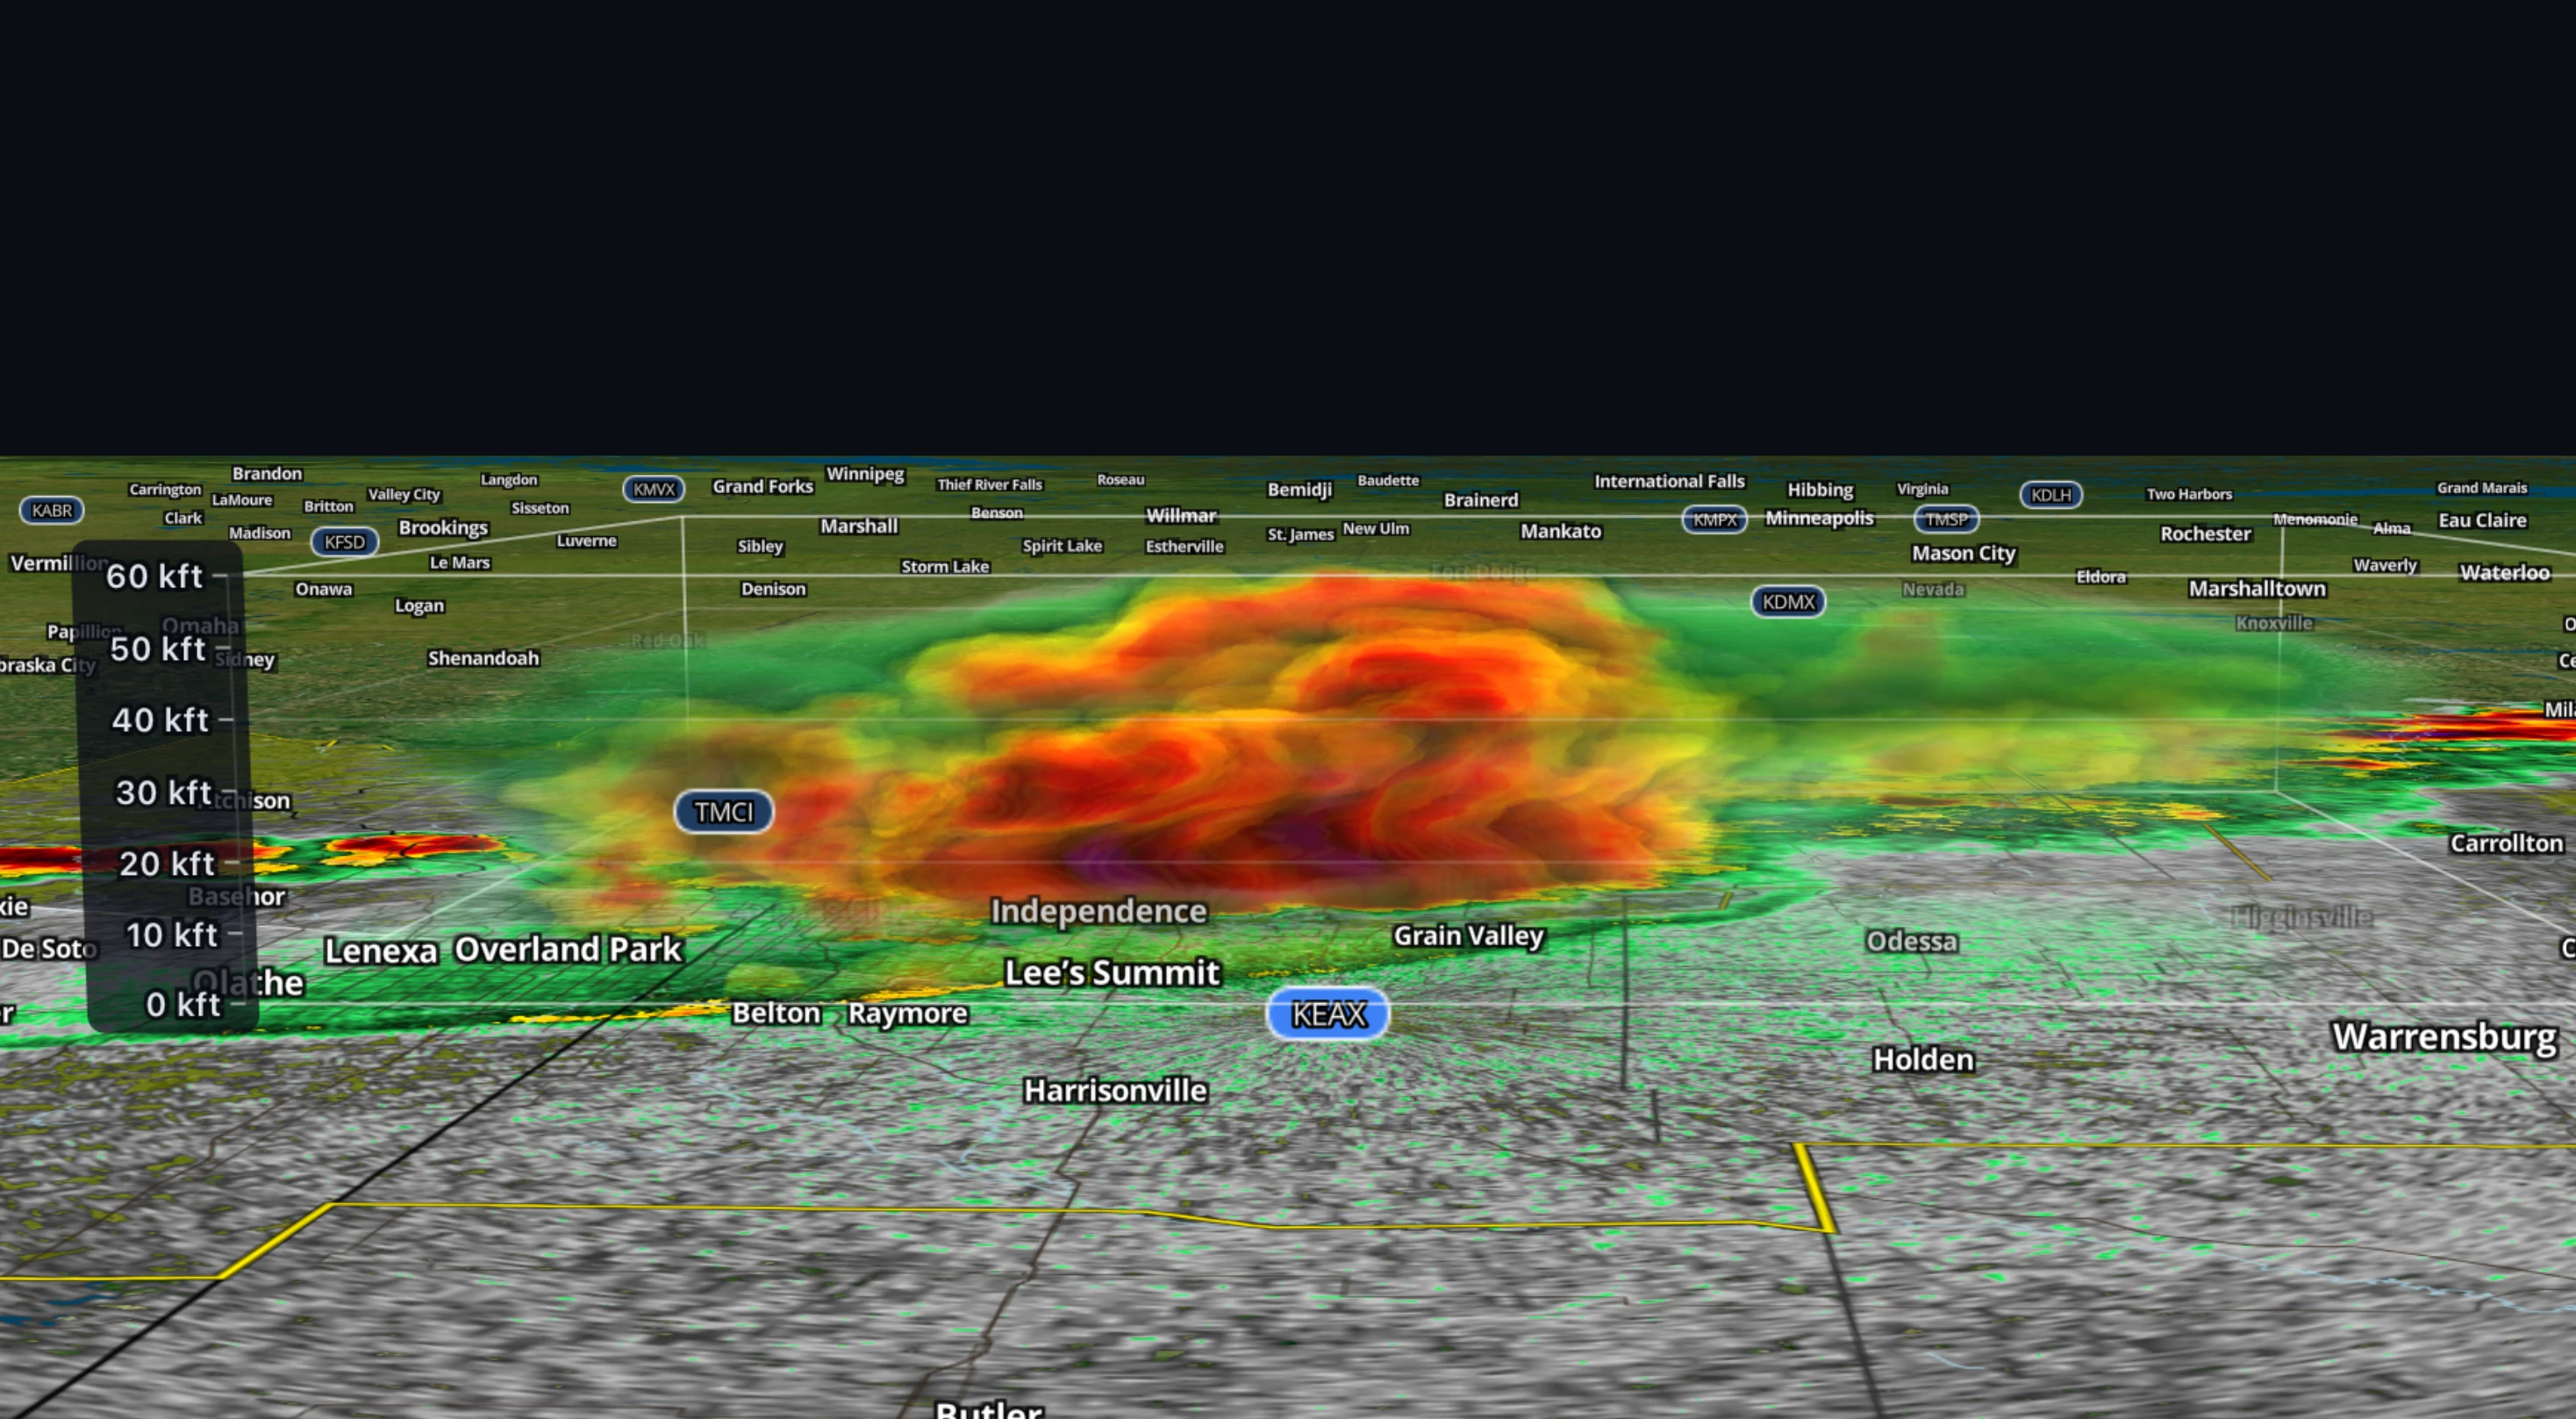
Draw a box around a storm to see its whole radar volume in 3D, then tilt, turn and zoom around it.
Show me in the app- Load a NEXRAD layer on the active map panel.
- Click 3D NEXRAD on the toolbar.
- Drag a box around the storm on the map.
- Right-click and drag on the map to tilt and turn the view.
- In the sidebar, pick a Product and a Display mode: lit volume, cloud, max or solid.
- Click 3D NEXRAD again to close the volume.
Tips
- Under Overlays, turn on model Temperatures, Wind barbs or a Height box in kft.
- Lower the opacity under Map radar to fade the flat radar under the volume.
- Drag vertical scale to stretch the storm’s height.
Shortcuts
- Alt + drag
- Draw a 3D volume box without the toolbar button
Radar cross sectionsProfessional
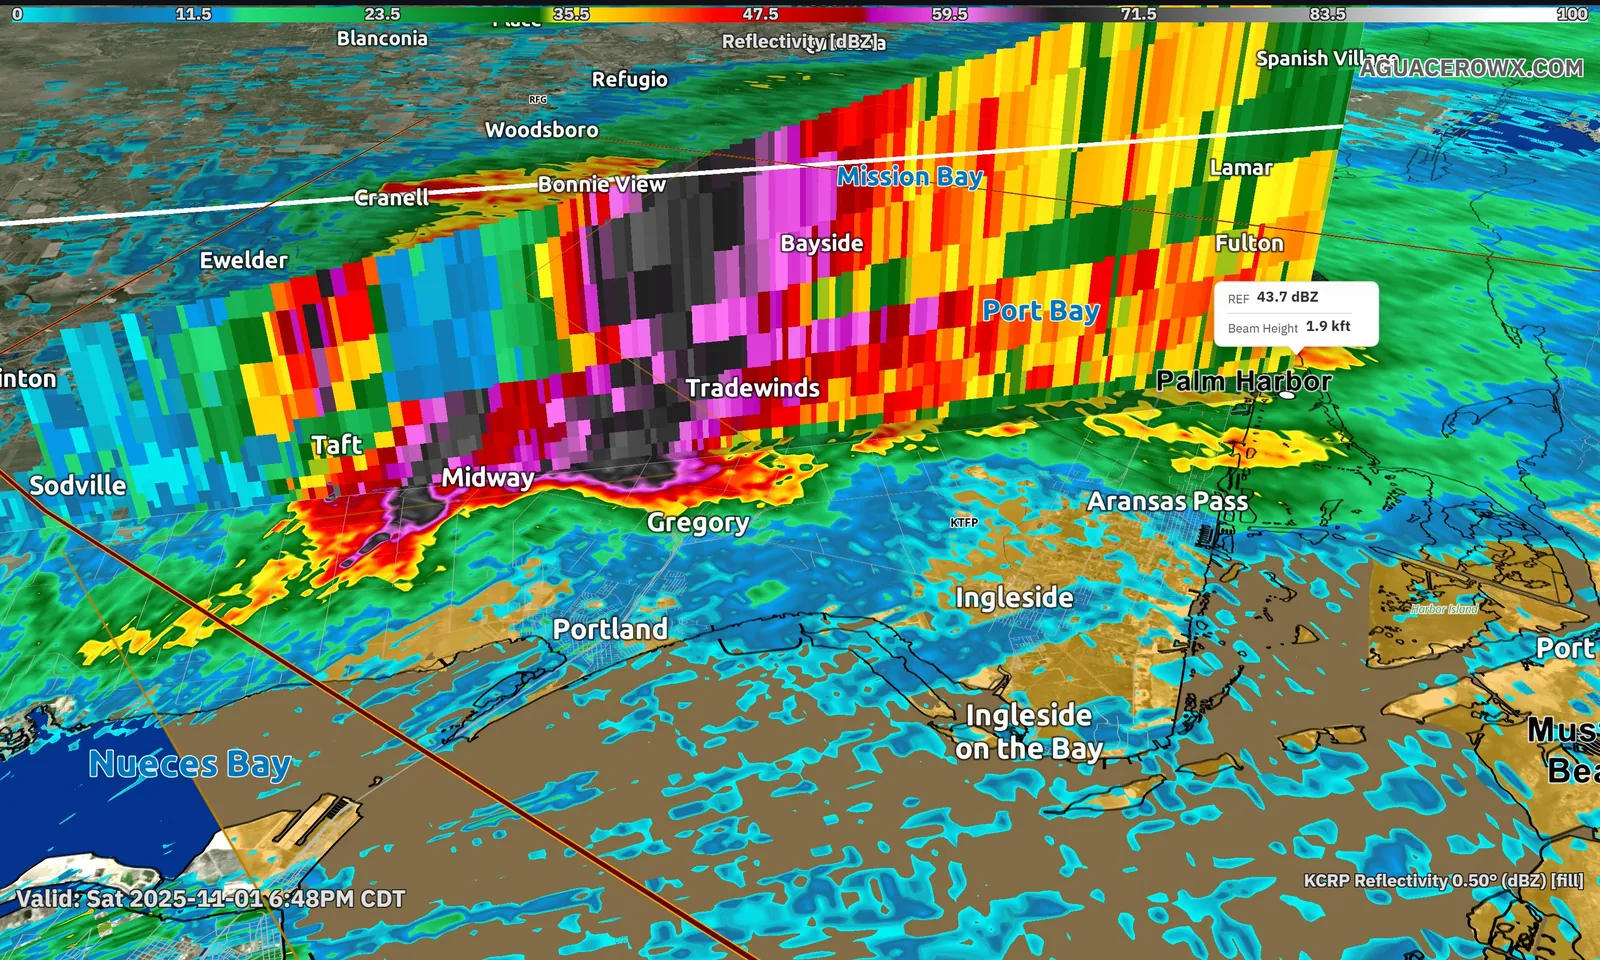
Slice through a storm along a line to see its vertical structure, standing on the map or as an image.
Show me in the app- Load a NEXRAD layer on the map.
- Click Cross section on the toolbar.
- Drag a line through the storm on the map.
- In the sidebar, set Show as to On map or Image.
- Pick a Product and adjust smoothing.
- Drag the A–B line on the map to move the slice.
Tips
- With radar on the board, the cross section tool slices the radar. Without radar, it draws a model cross section.
- In Image view, click Download PNG to save the slice.
- Under Overlays, add Temperatures and isotherms, Wind barbs or a Height box.
Shortcuts
- Ctrl + drag
- Draw a cross section without the toolbar button
Frame blendingProfessional
Cross-fade between radar scans as a loop plays, so storms morph instead of jumping.
Show me in the app- Click the Edit Layers tab in the sidebar.
- Click Edit Layer on the radar layer.
- Tick Frame Blending.
- Press Space to play the loop.
Tips
- Model fill layers have their own Frame Blending box in their layer settings.
- To blend every layer of one data type, open Settings > Data, pick the data type and set Frame blending to On.
European radar
148 national radars in 22 European countries, live and archived, picked the same way as NEXRAD sites.
Show me in the app- On the Edit Layers tab, click Add Layer > Radar and pick a product.
- Double-click NEXRAD sites on the toolbar to show the radar sites.
- Pan the map to Europe.
- Click a European radar site to load it.
Tips
- Each national service publishes its own set of products, so the product list can differ from NEXRAD.